The K7RA Solar Update
Even though this bulletin may arrive a little early (due to the Good Friday holiday on April 2), jokesters are still too late for sneaking any First of April pranks into this bulletin. No matter when you read it, this bulletin is dated April 2 for good reason. Your bulletin editor serves as a solid wall against nonsense. Do not think of us as humorless, for your editor has enjoyed perpetrating many elaborate pranks, japes and stunts, but never on April 1 (because that might give it away), and never in this bulletin (standing on principle). Also, we prefer to be perpetrators rather than recipients.
The solar report in Thursday's ARRL Letter attempted to correct some slightly faulty data regarding sunspot group numbers and their dates of emergence, but the result was more wrong than what it was attempting to correct. All of it is my fault.
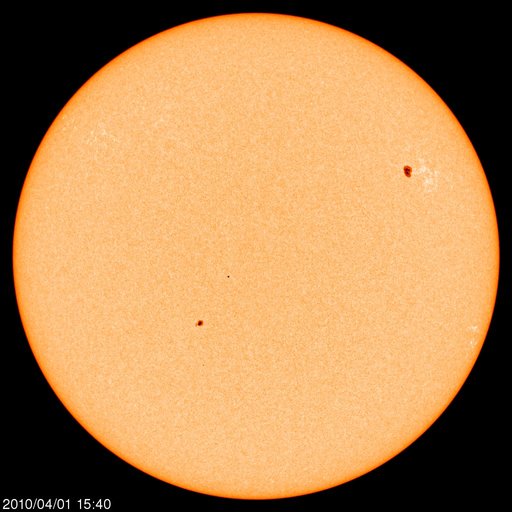
Now we see the problems -- which included not looking back far enough to find the dates that regions emerged and forgetting that the date of our source is the day after the date the data was gathered. The summaries are available for all to check. Sunspot group 1056 emerged earlier than reported, back on March 17, and was gone on March 24. The area it covered (all areas are in units of one-millionth of the solar hemisphere) on March 17-23 was 20, 50, 10, 30, 70, 50 and 5. On March 23, new sunspot group 1057 appeared, and through March 31, the area it covered was 5, 240, 400, 320, 380, 410, 290, 260 and 250. It is still with us.
On March 25, a small group, -- group 1058 appeared -- and only lasted two days. The area it covered was just 1 and 5. On March 27, group 1058 became a "plage without spots." What is a plage? In this context, not a beach at a seaside resort, but a bright region in the solar chromospheres; in this case, minus any spots. On March 27, group 1059 emerged, and through March 31, the size was 120, 100, 150, 130, and 70. Group 1059 never became as large as 1057.
Sunspot numbers for March 25-31 were 25, 27, 30, 33, 32, 32 and 23, with a mean of 28.9. The 10.7 cm flux was 87.6, 85.9, 88.1, 86, 83.2, 82.8 and 81, with a mean of 84.9. The estimated planetary A indices were 5, 4, 3, 7, 4, 5 and 4, with a mean of 4.6. The estimated mid-latitude A indices were 4, 2, 1, 4, 5, 4 and 5, with a mean of 3.6. The average daily sunspot numbers for the week were up more than 4 points to 28.9, and average daily solar flux changed from 84.2 to 84.9. The renewed sunspot activity seems constant and steady. No report yet from Geophysical Institute Prague, and the April 1 NOAA prediction is not available either, but the March 31 prediction had solar flux at 80 through April 2, then dropping to 75 (is that an expectation for 0 sunspots?) for April 3-5 then back to 80 on April 6-10. The report also predicted quiet planetary A index of 5 through April 5, then values of 7, 7, 8, 5 and 5 for April 6-10.
We have new 3-month moving averages of daily sunspot numbers through the end of March, which is centered on February, and the number has increased a few points from last time. The 3-month moving average of daily sunspot numbers centered on July 2009-February 2010 was 4, 4, 4.6, 7.1, 10.2, 15.2, 22.4 and 25.7. The rate of increase has slackened, but it steadily moves higher. Last week we reported that the trailing 50-day moving average of daily sunspot numbers for the prior week was 27.34, 28.18 for the end of last week. This week, ending on March 31, the trailing 50 day average is 26.8.
Sorry we are up against an early deadline here. Check next week for more propagation information, and perhaps a bit less solar data.
All times, unless otherwise noted, are UTC.
Amateur solar observer Tad Cook, K7RA, of Seattle, Washington, provides this weekly report on solar conditions and propagation. This report also is available via W1AW every Friday, and an abbreviated version appears in The ARRL Letter. Check here for a detailed explanation of the numbers used in this bulletin. An archive of past propagation bulletins can be found here. You can find monthly propagation charts between four USA regions and 12 overseas locations here. Readers may contact the author via e-mail.
Photo Gallery
Back


