The K7RA Solar Update
The average daily solar flux for the past week rose slightly, 116.2 to 119, but the average daily sunspot numbers declined more than 14 points (about 13 percent), to 92.6. Sunspot numbers for May 3-9 were 107, 101, 88, 104, 79, 90 and 79, with a mean of 92.6. The 10.7 cm flux was 114, 114, 116, 117.3, 121.7, 122.8 and 127.3, with a mean of 119. The estimated planetary A indices were 8, 4, 4, 5, 4, 9 and 24, with a mean of 8.3. The estimated mid-latitude A indices were 9, 4, 4, 5, 4, 8, and 19, with a mean of 7.6,
The predicted solar flux for the near term is quite a bit higher than the average for the past week. Solar flux on May 11-18 is 130, and then it drops sharply to 110 on May 19-22, 115 on May 23-25, 110 on May 26, 105 on May 27-31, 110 on June 1-2, and 115 on June 3-10. The predicted planetary A index is 12 on May 11-12, 10 on May 13, 5 on May 14-18, 8 and 10 on May 19-20, 15 on May 21-23, 8 on May 24, 5 on May 25-June 4, 12 on June 5-6, 18, 10 and 5 on June 7-9, 8 on June 10-11, then 5, 8, 5, 8 and 10 on June 12-16, and 15 on June 17-19.
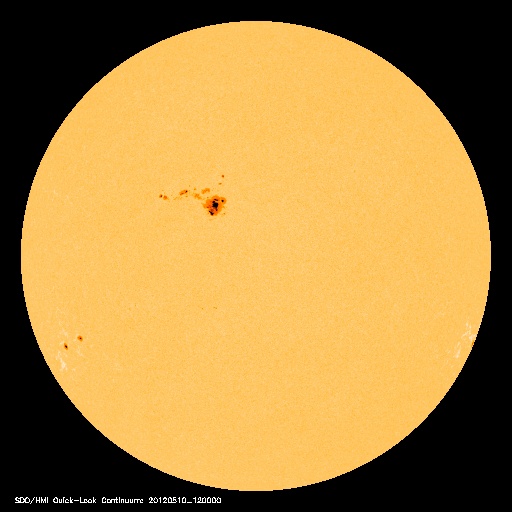
Right now, sunspot group 1476 has been producing a lot of activity, and could give us an X-class solar flare. It is currently pointed straight at Earth, at the center of the visible solar disk. This sunspot is the subject of news reports lately, including this one and this one. If you like your solar news with dramatic music, don’t miss these videos, here and here.
This week, you can compare the tables in the Preliminary Report and Forecast and the earlier version and see the slight decline in estimated and predicted smoothed sunspot numbers for October 2011-October 2012. These smoothed numbers are averaged over a whole year, so a current number would be an average made up of half predicted numbers and half actual sunspot numbers for the past half-year.
David Gerns, K1LD, of Plaistow, New Hampshire, sent a link to a remarkable article on the Carrington Event of 1859, the Great Auroral Storm. Note the exchange between the two telegraphers in which they observed better performance of the telegraph system by disconnecting their batteries, and just used the induced currents from the aurora! I also was not aware that recordings were made from magnetometers 150 years ago, such as the one shown in the article. Also note that at the end of the piece is a link to a collection of eyewitness reports of this event.
Josep, EA3AKY, of Catalunya, Spain wrote on May 4: “I'm a 6 meter DXer and I appreciate your information very much. This band is not easy and it sometimes surprises me. In spite of this low Sun activity, today I worked Jack, OA4TT, at 1810, 10,029 kilometers away. His CW signal was 519-529 with some flutter and quick fading. Jack has worked several other Spanish and Portuguese stations. After Jack, I worked UR7FM/MM in field IG28. Propagation to Jack was via E-skip (EA8 and CS3 were in at same time), linking to the F2 /TEP layer.”
Fred Honnold, KH7Y, of Ocean View, Hawaii, wrote: “We still are having openings just about every evening from 0500 to 0800 to DU7/PA0HIP, with very good signals; most of the time, we’re seeing them peak at S9+10. I was lucky and worked 9M0L on April 21. They were into KH6 for more than two hours with their beacon. Thanks go out to Dave, N2NL, who was able to alert them on 10 meters to man their 6 meter station and look toward Hawaii. I am not sure if any other Hawaiian stations worked them. Also, on April 21, I worked YN2N, 9M6XRO, DU7/PA0HIP -- all with big signals, 30+ over S9.”
Tom McGuire, W0VPI, of Davenport, Iowa, asked about a website that would show him real time MUF, or maximum usable frequency. The problem is there is no single MUF value, as it varies according to the path, or the location of the two endpoints. I mentioned that he could estimate MUF using W6ELprop. MUF programs are written to use the predicted smoothed sunspot number for the month. Apparently they aren’t any more accurate if you use the current daily sunspot number, but one compromise might be to average the sunspot number over the past few days.
For the day that I was using in my example, the average sunspot number would be 99. I calculated that at 2200 on that day, the MUF would be about 21.7 MHz between my place in Seattle and W0VPI in Davenport. I continued: “Interesting that throughout the day and night, the MUF doesn’t vary much. The lowest it goes at 3:00 AM my time (1000 UTC) is 15.1 MHz, so 20 meters is always open between us. Seventeen meters looks like the best band between us at the moment. You can see how location dependent MUF is by entering the default location for Brazil; the MUF is above 28 MHz from your place from 1530-2200, all day long.”
To look at real time conditions, you could go here. Note that you can customize it by band. This is another possible place to check out conditions. Once you set up a free trial account, you can go here. This site is in real time and uses real time data of ionosphere electron content. For any frequency, over the strip going out from your location, the MUF would be just below that frequency over the path of any green area.
All times listed are UTC, unless otherwise noted.
Amateur solar observer Tad Cook, K7RA, of Seattle, Washington, provides this weekly report on solar conditions and propagation. This report also is available via W1AW every Friday, and an abbreviated version appears each Thursday in The ARRL Letter. You can find a guide to articles and programs concerning propagation here. Check here and here for a detailed explanation of the numbers used in this bulletin. An archive of past propagation bulletins can be found here. You can find monthly propagation charts between four USA regions and 12 overseas locations here. Readers may contact the author via e-mail.
Photo Gallery
Back


