The K7RA Solar Update
There has been an exciting and dramatic rise in sunspot activity this week. The daily sunspot number was 188 on Monday, November 12 -- higher than it has been in more than a year. The last time the daily sunspot number was as high was on November 9, 2011, when it was 208. Prior to last November, we have to go back nine years -- November 26, 2003 -- into the previous solar cycle to find a number as high. On that date the sunspot number was 209. The average daily sunspot number from November 8-14 was 104.9, more than twice the previous week’s average of 49.7, while the average daily solar flux was 129.5, more than 32 points above the previous week’s average
Sunspot numbers for November 8-14 were 71, 65, 68, 106, 188, 108 and 128, with a mean of 104.9. The 10.7 cm flux was 104.1, 115.1, 122.2, 133.3, 143.8, 146.2 and 142.1, with a mean of 129.5. The estimated planetary A indices were 3, 2, 2, 3, 5, 15 and 33, with a mean of 9. The estimated mid-latitude A indices were 2, 1, 1, 2, 4, 10 and 21 with a mean of 5.9.
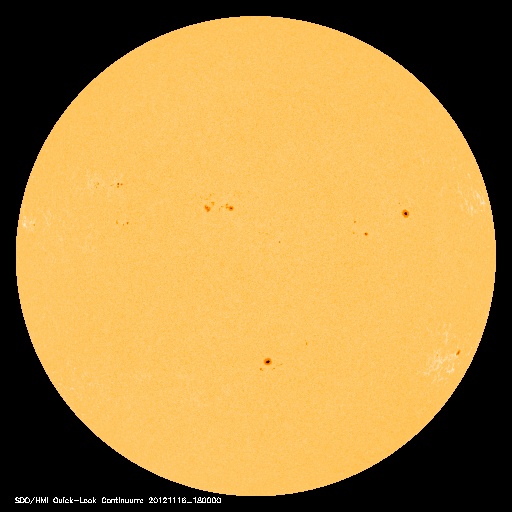
A coronal mass ejection (CME) on November 13 caused a geomagnetic storm on November 13-14, driving the planetary A index to 33 on November 14. Aurora was visible across Northern United States. NASA estimates a 40 percent chance of M-class solar flares today, and if any come from sunspot group 1614, they would be Earth-directed.
The NOAA/USAF prediction on Thursday, November 15 showed the solar flux at 145 on November 16-19, 140 on November 20-21, down to 135, 125 and 105 on November 22-24, 100 on November 25-26, and then 90 on November 28-December 1. Then they predict 95, 100 and 105 on December 2-4, 110 on December 5-7, and 115 on December 8-11. The predicted planetary A index is 8 on November 16-17, 5 on November 18-December 4, 10 on December 5-8, 5 on December 9, 8 on December 10 and back down to 5 on December 11-15.
Conditions should be good for this weekend’s ARRL SSB Sweepstakes. This is a domestic contest that counts ARRL and RAC Sections as multipliers. Even if you aren’t competing, it is fun to get on and just casually operate. If you do this toward the end of the contest, you will make some operators happy who are trying to squeeze out a few more points. Toward the end, they have been at it for more than a day (the contest lasts 30 hours); while searching for new contacts, they’ve heard the same calls over and over, and you joining in during the last few hours will generate fresh excitement.
Max White, M0VNG, of Worcester, UK calls our attention to an amateur astronomer in Bangladesh who runs a web page for monitoring sudden ionospheric disturbances. Fortunately, I have not witnessed any SID events on this page.
Check here for a frequently updated blog about space weather.
Stu Phillips, K6TU, has a fascinating and powerful new online tool that uses VOACAP, but automates the whole process and generates useful graphics. You can read a description of it here and give the service a free trial. VOACAP uses the predicted smoothed sunspot number for the month, and will generate the same prediction for the whole month, so there is no variation from day-to-day. With Stu’s service, you set up your location, select the month and year, decide if you want all HF bands or just the five bands contests use, select either a worldwide map or just North America, select typical antenna and transmit power configurations and shortly you will receive an e-mail with a link to PDF images for each hour for each band. It’s fun to step through the hours and watch the propagation change.
All times listed are UTC, unless otherwise noted.
Amateur solar observer Tad Cook, K7RA, of Seattle, Washington, provides this weekly report on solar conditions and propagation. This report also is available via W1AW every Friday, and an abbreviated version appears each Thursday in The ARRL Letter. You can find a guide to articles and programs concerning propagation here. Check here and here for a detailed explanation of the numbers used in this bulletin. An archive of past propagation bulletins can be found here. You can find monthly propagation charts between four USA regions and 12 overseas locations here. Readers may contact the author via e-mail.
Photo Gallery
Back


