The K7RA Solar Update
As soon as sunspot 1041 went over the horizon at the end of January, sunspot 1043 emerged, high in our Sun's northern hemisphere. The average daily sunspot number this week fell more than 13 points to 14.6, and average daily solar flux declined nearly 7 points to 75. The geomagnetic activity was up, and the average daily planetary A index rose 2 points to 5.1. Sunspot numbers for January 28-February 3 were 13, 12, 25, 14, 16, 11 and 11, with a mean of 14.6. The 10.7 cm flux was 76.3, 73.3, 75, 75.3, 75.3, 75.2 and 74.4, with a mean of 75. He estimated planetary A indices were 3, 2, 4, 3, 6, 9 and 9, with a mean of 5.1. The estimated mid-latitude A indices were 2, 0, 3, 3, 7, 7 and 7, with a mean of 4.1.
The average daily sunspot number for January was 21.3; the 3-month trailing average -- centered on December -- was approximately 15.2. Like last month, the average for the month greater than the 3-month average centered on the previous month is a good trend. The difference between the monthly average sunspot number and the trailing 3-month average has been positive since September. The difference for November, December and January was 0.6, 5.5 and 6.2. For 2009, the 3-month average centered on January through December (resolved to two digits beyond the decimal point) was 2.19, 2.02, 1.49, 2.01, 4.23, 5.2, 4, 4, 4.64, 7.1, 10.16 and 15.15.
The predicted planetary A index for February 5-9 is 5, 10, 12, 12 and 5. The predicted solar flux for those same days is 80, 82, 85, 88 and 90. Geophysical Institute Prague sees quiet conditions February 5, active February 6, quiet to unsettled February 7, quiet February 8, active February 9 and quiet to unsettled February 10-11.
We received an interesting report recently from Peter Thulesen, OX3XR, in Nuuk, Greenland. He writes: "During the last two days - Tuesday, February 2 and Wednesday, February 3 -- we have observed shortwave conditions quite different from what we normally are used to. On around 21 UTC, Jan, OX3DB was listening to very weak PSK signals on 20 meters from a VK5 station. Suddenly the signals were very strong for a short period where Jan worked the VK5 station. Thereafter, the VK5 stations signals disappeared. Jan was not able to find out if the VK5 station signals were short-path or long-path. Later, around 2200 to 2400 UTC, we observed quite heavy aurora activity over Nuuk, on Greenland's west coast. On February 3 around 0100 UTC, the aurora observed from Nuuk area had changed from few rather strong green bands to a wide area with weak green 'clouds' covering the sky overhead from southwest to northeast. This evening, the aurora situation was the same as observed yesterday evening. The K index is quite low here late Wednesday evening and the aurora oval activity shows low activity (activity level on or below 1). When the aurora- and K-index are that low, I wonder what causes the bad conditions observed here in Nuuk. On both days we have experienced the shortwave bands have been closing down very quick within few minutes around 2200-2300 UTC."
Carl Luetzelschwab, K9LA, sent in the following item: "A really neat picture showed up (you can view the February 2 report in the 'archives' link at the top right of the referenced Web site). It's an image from the US military's DMSP-18 weather satellite. DMSP stands for Defense Meteorological Satellite program. The picture shows a thin intense band of aurora north of Norway at 1817 UTC on February 1. It's interesting to compare this DMSP picture to the 1824 UTC auroral oval image on the same date. Why does the auroral oval image (called a pmap) indicate lots of orange, but the DMSP picture only shows a thin intense band? The reason is the auroral oval image simply indicates where visible aurora can occur based on the energy and flux of the electrons measured during the satellite pass. The auroral oval image is not a real-time picture of what's going on -- it's one of 10 canned pictures correlated to the 10 activity levels. So don't assume an orange or red auroral oval is full of ionization. As the DMSP picture and the auroral oval image suggest, the intense auroral bands generally occur at the equatorward edge of the auroral oval. For more on what's happening in the auroral oval, visit my Web site."
Thanks, Carl!
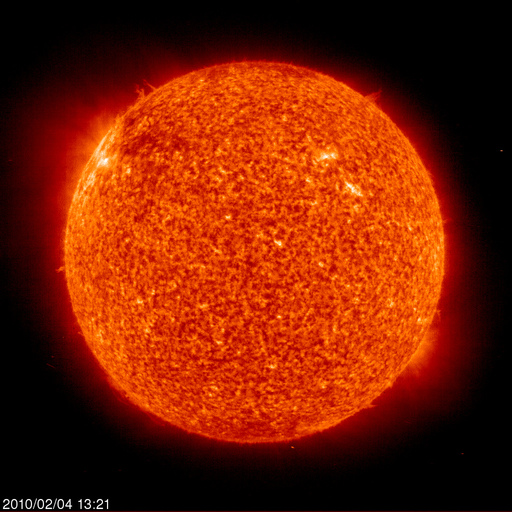
Doc Kelly, K4WY, of NASA's Space Operations Mission Directorate sent a link to information on the new Solar Dynamics Observatory, set to launch Tuesday, February 9, 2010 around 1530 UTC from Florida.
Whitham Reeve of Anchorage, Alaska operates a magnetometer. He sent a printout showing recent geomagnetic activity. You can observe his magnetometer in action here.
Jon Jones, N0JK, of Kansas says 6 meters really opened up on February 1, with openings all over the Eastern US and the Southeast: "Big 6 meter E-skip opening January 31 and February 1. After a long dry spell, 6 meters opened up with a bang on the last day of January. Noted Es spots on DX Summit from 1630 UTC on for stations along the Atlantic seaboard, with a long duration opening - more than 8 hours continuous for some along the East Coast. C6AGN just spotted by K4ZOO at 0050 UTC February 1. Es stayed east of Kansas most of the day until late Sunday afternoon. Around 2340 UTC, Florida and the Carolinas begin coming in. The eastern stations that poked through had large pileups of 4s, 5s, and 0s calling them. While driving back to Wichita, I copied KA2LIM (FN12) ragchewing for quite a while. I also heard AI1C (FN34) work N0LL. I had a partial QSO with K2MPE (FN13); just after he answered me, my whip fell off the car. We had freezing fog and the ice built up on the whip until it got too heavy and off it went. It was dangling off the car by the coax with the tip dragging on the road. I pulled off the turnpike and put it away."
Amateur solar observer Tad Cook, K7RA, of Seattle, Washington, provides this weekly report on solar conditions and propagation. This report also is available via W1AW every Friday, and an abbreviated version appears in The ARRL Letter. Check here for a detailed explanation of the numbers used in this bulletin. An archive of past propagation bulletins can be found here. You can find monthly propagation charts between four USA regions and 12 overseas locations here. Readers may contact the author via e-mail.
Photo Gallery
Back


