The K7RA Solar Update
This week’s bulletin is written by Tomas Hood, NW7US, who is filling in for Tad Cook, K7RA.
Sunspot numbers and solar flux increased this week, with the average daily sunspot numbers up more than 32 points to 53, and the average daily 10.7-cm solar flux up more than 3 points to 84.5. These are the numbers from last Thursday through this Wednesday, August 5 through August 11. The sunspot count on August 11 was 66, consisting of four active sunspot regions: 1093, 1095, 1096, and 1097. The largest of these was 1093, with a relative size of 130 millionths of a solar hemisphere. The sunspot count of 66 is the highest yet recorded in Solar Cycle 24. Another noteworthy development this week is that five active sunspot regions were reported on August 12; however, most of the spots were small, resulting in a daily sunspot count of 50.
Sunspot numbers for August 5-August 11were 54, 49, 47, 46, 53, 56 and 66, with a mean of 53. The 10.7 cm flux was 82.7, 82.0, 90.5, 82.6, 84.1, 83.5 and 85.8, with a mean of 84.5. The estimated planetary A indices were 10, 8, 5, 4, 10, 8 and 10, with a mean of 7.9. The estimated mid-latitude A indices were 7, 6, 4, 2, 7, 7 and 9, with a mean of 6.
While solar activity was higher this week, geomagnetic activity has been quiet, with daily planetary A indices ranging from 4-10, and the daily mid-latitude A indices ranging from 2-9. The predicted planetary A index for August 13-14 is 5, then 8 on August 15, 12 on August 16, then 5 on August 17-21. NOAA/USAF expects geomagnetic activity to be mostly quiet for the next week; a very small coronal hole is rotating across the solar disc, but will have little if any influence on the geomagnetic activity this coming week.
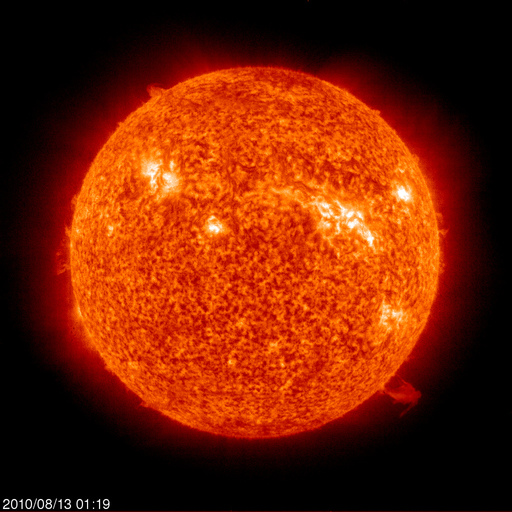
Another newsworthy event was the M-class X-ray flare that erupted from active sunspot region 1093 on August 7. This flare was 10 times more powerful than the C-class flare on August 1 that caused so much news media attention. This M1.0 magnitude solar flare peaked at 1824 UTC on August 7 and ejected a huge mass of coronal plasma. Many hoped that the coronal mass ejection, or CME, originating from sunspot region 1093 would trigger auroral displays around the world, just like those that occurred last week; however, because this CME was not fully Earth-directed, most of the CME missed the magnetosphere, resulting in only the slightest increase in geomagnetic activity between August 10 and 11.
This flare -- one of the biggest since the start of Solar Cycle 24 -- also triggered a metric type II radio burst. This kind of radio burst can be heard from a radio receiver tuned to, say, a 6 meter frequency as the burst occurs. The burst sounds like rushing wind. You can hear a recording of a type II radio burst as recorded on 50 MHz by Thomas Ashcraft on April 2, 2001 at 2151 UTC that occurred during the X22.0-magnitude X-ray flare. Incidentally, the April 2, 2001 flare is the second largest event on record after the X28.0-magnitude mega-flare that occurred on November 4, 2003.
A movie of the August 7 M-class flare showing a series of filtered views of the event as seen by the Solar Dynamics Observatory’s Atmospheric Imaging Assembly is available in high definition.
While you are viewing movies, be sure to check out this movie that shows a simulation of Earth’s magnetosphere on August 3. About two-thirds into the movie, you can see the arrival and then the passing of the coronal mass ejection from the multiple-eruption event of August 1, 2010. Also, check out this movie of the massive filament eruption associated with the C-class flare of August 1, 2010.
The late Robert Brown, PhD, NM7M, proposed that the hard X-ray energy present in the wavelengths from 1 to 8 Angstroms provide the most effective ionizing energy throughout all of the ionospheric layers in our atmosphere. The GEOS satellites measure these wavelengths and the resulting measurements are reported as the background X-ray level throughout the day. A daily average is reported, as well. Dr Brown recorded the daily background X-ray levels for several sunspot cycles and discovered that during solar cycle minimum periods, the background X-ray levels remained at the A class level. During the rise and fall of a solar cycle, the background X-ray energy levels remained mostly in the B range. During peak solar cycle periods, the background energy reached the C and sometimes even M levels.
Armed with this information, can we discover any clues as to the current status of Solar Cycle 24? The Space Weather and Radio Propagation page maintained by NW7US includes a graph showing the daily and monthly averaged hard X-ray flux since the end of Solar Cycle 22. The plot reveals a noticeable rise in Solar Cycle 24 activity. We’re seeing the energy rise to the B level more often as 2010 progresses, supporting the view that Solar Cycle 24 is alive and moving along toward an eventual sunspot cycle peak in several years.
All times listed are UTC, unless otherwise noted.
Amateur solar observer Tad Cook, K7RA, of Seattle, Washington, provides this weekly report on solar conditions and propagation. This report also is available via W1AW every Friday, and an abbreviated version appears each Thursday in The ARRL Letter. You can find a guide to articles and programs concerning propagation here. Check here for a detailed explanation of the numbers used in this bulletin. An archive of past propagation bulletins can be found here. You can find monthly propagation charts between four USA regions and 12 overseas locations here. Readers may contact the author via e-mail.
Photo Gallery
Back


