The K7RA Solar Update
HF radio conditions were good over this past week, with the average daily sunspot numbers up more than 5 points to 45.3, and the average solar flux rising 1.5 points to 84.4. On Wednesday, September 29, the solar flux was 90.7; the last time flux values were nearly this high was August 7 at 90.5, and it last topped this value at 91.8 on March 13, 2010. A coronal wind on September 24 provided the moderate geomagnetic activity for the week, with the planetary A index rising to 13. Sunspot numbers for September 23-29 were 34, 34, 40, 57, 52, 49 and 51, with a mean of 45.3. The 10.7 cm flux was 84.3, 82.6, 82.9, 83.9, 83, 83.2 and 90.7, with a mean of 84.4. The estimated planetary A indices were 5, 13, 7, 6, 6, 7 and 5, with a mean of 7. The estimated mid-latitude A indices were 6, 9, 5, 8, 5, 7 and 2, with a mean of 6.
With the end of September comes the opportunity to examine some average sunspot numbers based on calendar months. These numbers look good. Each month since early 2007, we have taken a 3-month moving average of sunspot numbers. The hope in the beginning was to help us spot the bottom of the sunspot cycle without resorting to smoothed sunspot numbers, which average a year of sunspot data. But three months of data allows a lot of smoothing of short term variation. Now at the end of September, we know the 3-month average centered on August, taking all the data from July, August and September. It is a simple arithmetic average in which we add all the sunspot numbers together, and then divide the sum by the number of days in those 3 months the data was taken from.
The three-month moving averages of daily sunspot numbers for October 2008-August 2010 were 4.5, 4.4, 3.6, 2.2, 2, 1.5, 2, 4.2, 5.2, 4, 4, 4.6, 7.1, 10.2, 15.2, 22.4, 25.7, 22.3, 18.5, 16.2, 20.4, 23.2 and 28.9. This takes into account all of the daily sunspot numbers from September 1, 2008 through September 30, 2010. It is clear that there was a minimum centered around April through July 2008, and that for the past few months numbers have risen steadily. The monthly averages for August and September 2010 were 28.2 and 35.7.
For this week, NOAA and USAF predict quiet geomagnetic conditions with a planetary A index of 5 on October 1-2, 7 for October 3-5 and 5 again on October 6-10. Geophysical Institute Prague sees quiet conditions October 1-3, unsettled October 4-5 and quiet October 6-7.
Dave Fisher, KA2CYN, of New City (Rockland County), New York, says he had a very active weekend in the CQ World Wide RTTY Contest last weekend, September 25-26. With a 4-band roof-mounted rotatable dipole and low power on 10-40 meters, he made 513 contacts overall, with six contacts into South America on 10 meters and 161 in North America on 40 meters. Twenty meters the best band into Europe, with 101 QSOs on that band.
Andy Gudas, N7TP, of Amargosa Valley, Nevada, wrote: “Since we have now entered the ‘Solar Cycle That Couldn’t,’ is there any way to compare where we think we are in the new sunspot cycle with an average cycle, or maybe a really poor cycle? I think we’re something like two years into the new cycle and not much is happening.”
Check here for a graphic comparison of Solar Cycles 21-23, with the beginning of 24 plotted. The time axis is marked in months since the start of the cycle, which could be somewhat subjective. Note that smoothed sunspot numbers are displayed here, and since that takes a year of data to compute, the latest number always lags the current date by about six months. The latest update of this chart (as of October 1) was September 4.
You can see another comparison here. Note that Solar Cycle 24 is just a little squiggly line to the right of Solar Cycle 23. This page says the current forecast is for the current cycle to peak in 2013 with a smoothed sunspot number of 50-70. If that turns out to be true, it will be a much lower cycle than previous ones.
All times listed are UTC, unless otherwise noted.
Amateur solar observer Tad Cook, K7RA, of Seattle, Washington, provides this weekly report on solar conditions and propagation. This report also is available via W1AW every Friday, and an abbreviated version appears each Thursday in The ARRL Letter. You can find a guide to articles and programs concerning propagation here. Check here for a detailed explanation of the numbers used in this bulletin. An archive of past propagation bulletins can be found here. You can find monthly propagation charts between four USA regions and 12 overseas locations here. Readers may contact the author via e-mail.
Photo Gallery
-
 The Sun, as seen ...
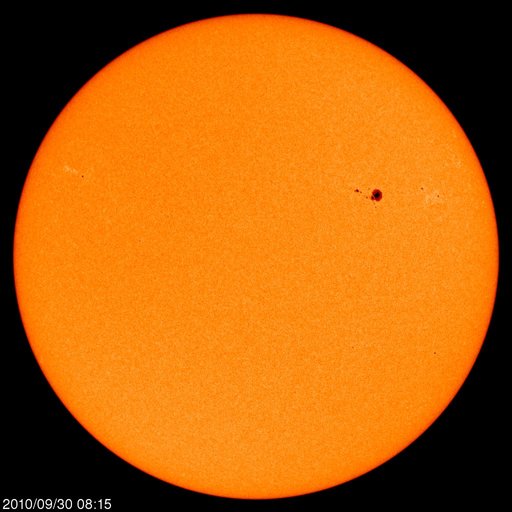
Back


