The K7RA Solar Update
Currently, there are seven sunspot groups that are visible. But even so, the average daily sunspot number is down more than 7 points over the past reporting week (April 28-May 4), when compared to the previous seven days. The average daily solar flux was off nearly 5 points, compared to the earlier period. Sunspot numbers for April 28-May 4 were 71, 70, 76, 57, 51, 77, and 72 with a mean of 67.7. The 10.7 cm flux was 110.4, 109.6, 109.5, 106.1, 109.8, 107 and 108.5, with a mean of 108.5. The estimated planetary A indices were 3, 12, 24, 19, 20, 13, and 6 with a mean of 13.9. The estimated mid-latitude A indices were 1, 8, 17, 13, 14, 8, and 3 with a mean of 9.1.
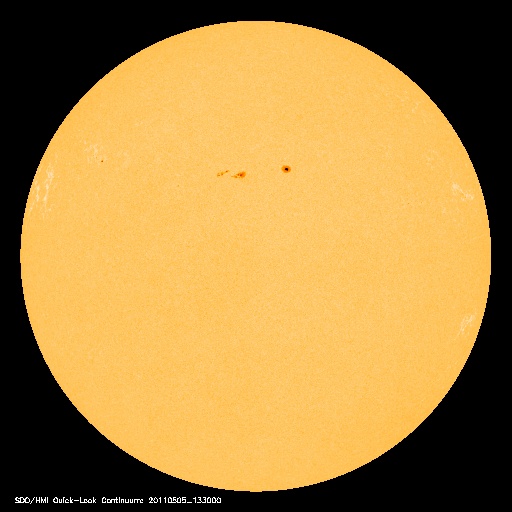
Sunspot group 1201 first exhibited spots on Thursday, May 5, although it was first numbered as a plage without spots back on April 28. A plage is a bright area on the Sun where sunspots may appear. Group 1207 was also new on Thursday. Click here to see a daily summary of sunspot groups, including their total area.
A solar wind stream from a coronal hole induced a high latitude geomagnetic storm at the end of April. Middle-latitude geomagnetic K indices measured at Fredericksburg, Virginia went as high as 4, and the April 30-May 2 middle-latitude A index was 17, 13 and 14. The planetary K index hit 5 on April 30, and the planetary A index over the same three day period was 24, 19 and 20. High latitude areas were more sharply affected, and Alaska’s college K index rose as high as 7, and the same three day period saw the college A index at 43, 56 and 37.
A bulletin received at 5:19 PM local time on Friday, April 29 (0019 UTC on April 30) from IPS Radio and Space Services in Australia told of the impending geomagnetic disturbance: “Increased geomagnetic activity expected due to coronal hole high speed wind stream for 30 April 2011.” Click here to subscribe to these alerts.
The latest prediction shows more geomagnetic activity coming May 9-10, when the predicted planetary A index is 18, then 15. The USAF/NOAA prediction shows a planetary A index of 7 on May 6-8, 18 and 15 on May 9-10, 7 on May 11-12 and 5 on May 13-16, rising again to 15 on May 17, then 5 on May 18-25 and 12, 22, 18, 18 and 15 on May 26-30. The same prediction shows solar flux at 105 on May 6-8, 100 on May 9-13 and 115 on May 14-21. Geophysical Institute Prague predicts quiet conditions on May 6-7, quiet to unsettled May 8, unsettled to active May 9, unsettled May 10 and quiet again on May 11-12.
Now that we are in the first week of May, it is time to look at the three month moving average of sunspot numbers. The latest value is another increase -- from 30.1 at the end of January to 35.3 at the end of February, 55.7 at the end of March and 72.3 at the end of April. The monthly average of daily sunspot numbers for April was 80.8, about the same as March, which was 81.1.
We calculate this average by summing all of the daily sunspot numbers for three calendar months, then dividing by the number of days. Each month, we incorporate a new month of data and drop off one old month. The three month moving averages of daily sunspot numbers ending on April 2010-April 2011 were 22.3, 18.5, 16.4, 20.4, 23.2, 28.9, 33, 35.6, 31, 30.1, 35.3, 55.7 and 72.3.
There has been very little change in the predicted smoothed sunspot numbers from NOAA/SESC in the past month. Compare page 14 on the beginning of April table with the latest table, also on page 14; only August through October 2011 have changed, each being 1 point lower. Each of these smoothed values represents an average of a year’s worth of data, either known numbers or predicted. For May 2011, about half of the value is based on predicted numbers. November 2010 is probably the latest date that shows a number based on all known values, as are all previous months.
Bob Scaife, G7PAF, offers an interesting propagation tool, the ability to monitor 20 meter PSK activity from his station in England. Go to his web page and click on the live screen on the left, which takes you here. Not sure how well this works if multiple bulletin readers try to hook up at the same time, but Bob says one possible utility is to send a PSK signal and monitor it from his QTH.
During 10 minutes of casual monitoring, I copied SQ3LMY, UA9WRG, OH2FDO, RJ6JK, RA3WBZ, OE5KEO, EA1GCD, YU7NW, F5AXG, IZ5RFR, IZ7SIA, CT2FPY, EA3AJY, EA3AHH, YU1LC, CT4RC and I6MBK. Many of those stations have photos of their radios and antenna systems on QRZ.com, and some even have links from their QRZ.com page to monitor their station or view them on a web cam as they operate.
Ted Turk, WB8ADA, of Euclid, Ohio, calls our attention to an item in the current June 2011 issue of Sky & Telescope, titled “Why the Sun Had No Spots.”
Jon Jones, N0JK, reminds us that sporadic-E season is upon us, and there was widespread 6 meter E-skip on April 27-28. On 6 meters on April 28 from Lawrence, Kansas -- using an FT-897 and an attic dipole -- he worked VE3FZ and VE3KU around 0245 with strong SSB signals. Sporadic-E activity on 6 and 10 meters should be increasing through the month of May.
Larry Jones, K5ZRK of Sandersville, Mississippi is very active on 60 meters, and is wondering if his favorite band might be affected by heavy rain and stormy weather, causing a scattering effect. He writes: “The night all the tornadoes hit the Southeast [Editor’s Note: He is in south Mississippi, 90 miles from the Gulf of Mexico], which was April 27 (April 28 UTC), I ran a sked with a station on 60 meters for a new grid square. WB0HBJ was mobile in his 18 wheeler and I was QRP (about 3.8 W out) and in the middle of the rain front that extended from South Mississippi to New York and over to the Atlantic. WB0HBJ was 800 miles away in EM09 and his signal would peak above S9 and then drop off rapidly. He was in flat prairie land, so he was not picket fencing due to his terrain. I have noticed this phenomenon on 60 meters before. I was in the big band of rain and WB0HBJ was not. I have noticed that when a station at a distance is transmitting into the rain, his signal has short strong peaks and then drops out. I use low noise receive antennas on 60 meters that are directional, along with a preamp. My transmit antenna was a 60 meter vertical with 120 ground radials and with the vertical I could not hear him.”
All times listed are UTC, unless otherwise noted.
Amateur solar observer Tad Cook, K7RA, of Seattle, Washington, provides this weekly report on solar conditions and propagation. This report also is available via W1AW every Friday, and an abbreviated version appears each Thursday in The ARRL Letter. You can find a guide to articles and programs concerning propagation here. Check here and here for a detailed explanation of the numbers used in this bulletin. An archive of past propagation bulletins can be found here. You can find monthly propagation charts between four USA regions and 12 overseas locations here. Readers may contact the author via e-mail.
Photo Gallery
Back


