The K7RA Solar Update
We saw a decline in sunspot activity this week with a 23 point drop in the average daily sunspot numbers and a nearly 9 point decline in the average daily solar flux. These compare, of course, to the numbers for the previous reporting week, which always runs from Thursday through Wednesday. Sunspot numbers for May 12-18 were 29, 29, 64, 54, 63, 57 and 65, with a mean of 51.6. The 10.7 cm flux was 92.8, 91.5, 91.4, 94.5, 92.2, 91.5 and 90.6, with a mean of 92.1. The estimated planetary A indices were 3, 4, 4, 11, 12, 10 and 6, with a mean of 7.1. The estimated mid-latitude A indices were 2, 3, 3, 9, 10, 8 and 4, with a mean of 5.6.
But with this decline in activity, there were three new sunspot groups on May 14 and then one new sunspot group each day following, through May 18. But on May 19, there was no new sunspot group and the daily sunspot number declined from 65 on Wednesday to 36 on Thursday. There was heightened geomagnetic activity from May 15-17, with the planetary A index in the low double-digits.
The latest prediction from NOAA/USAF calls for a much lower solar flux than predicted on Wednesday, May 18. The forecast predicts solar flux readings of 84 and 82 on May 20-21, then 80 on May 22-26, jumping to 90 on May 27 and 110 on May 28-30. The predicted planetary A index is 7 on May 20-21, 5 on May 22-25, then 8, 22, 18, 15, 15 and 8 on May 26-31. Geophysical Institute Prague predicts quiet conditions May 20-21, quiet to unsettled May 22 and quiet May 23-26. On Wednesday, May 18, the solar flux was predicted at 92 on May 20-26, much higher than numbers forecast a day later and referenced above.
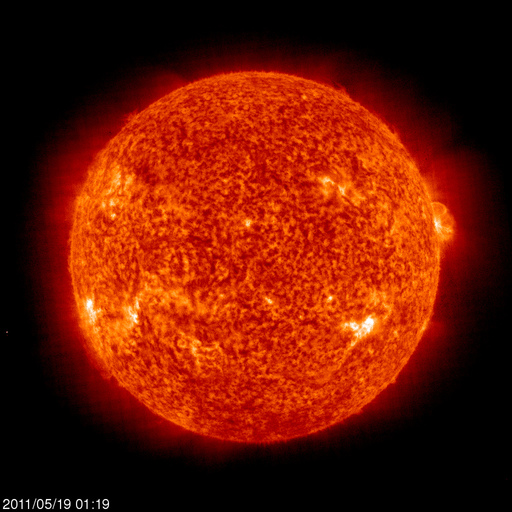
Last week’s bulletin mentioned that lately, most sunspots are appearing in the Sun’s northern hemisphere, but on May 19, they are all in the southern hemisphere. Go here, and on the upper right, check the archive for May 18. Note the two sunspot groups -- 1214 and 1216 -- are in the southern hemisphere. Now change to May 19, and note sunspot group 1218 is also in the southern hemisphere. On May 20, it shows all sunspots only in the southern half.
Today, the new June 2011 issue of WorldRadio Magazine is available online, for free. Check out Carl Luetzelschwab’s, K9LA, propagation column on pages 30-33. He gives an interesting treatise on solar flux and sunspot numbers.
The only mail this week was from James Garvin, K4FNC, of Fayetteville, North Carolina. Instead of the usual type of question about propagation, he asked: “Can you tell me when is the best time to make contact with the space station on 2 meters or the 440 frequencies?”
Quite a bit of information on ARISS is on the ARRL website. If you click on the “Frequently Asked Questions” link on the left side, this gives you a lot of the details, such as how to track the space station. The link to AMSAT even gives a method for tracking that doesn’t need your own tracking software. Click on “Online Satellite Pass Predictions,” select “ISS,” and enter FM05nb for the grid square for K4FNC and click “Predict” to get the time for AOS (Acquisition of Signal) and LOS (Loss of Signal) for his location.
All times listed are UTC, unless otherwise noted.
Amateur solar observer Tad Cook, K7RA, of Seattle, Washington, provides this weekly report on solar conditions and propagation. This report also is available via W1AW every Friday, and an abbreviated version appears each Thursday in The ARRL Letter. You can find a guide to articles and programs concerning propagation here. Check here and here for a detailed explanation of the numbers used in this bulletin. An archive of past propagation bulletins can be found here. You can find monthly propagation charts between four USA regions and 12 overseas locations here. Readers may contact the author via e-mail.
Photo Gallery
Back


