The K7RA Solar Update
The New Year brings dreams of solar cycles of old, so distant now, sweetly remembered for their profusion of sunspots. We hear many times from operators who became licensed as teenagers at the peak of Solar Cycle 19, in the late 1950s, when a few watts and a modest radiator on 10 meters could span the globe every day and night.
If you were a teenaged ham at the peak of Solar Cycle 19, you looked forward to the next peak in activity, but were probably disappointed when Solar Cycle 20 peaked around 1969 with somewhat of a broader peak, but at a far lower level.
Solar Cycle 21 peaked around 1980, and was quite an improvement over the last cycle, as was Solar Cycle 22, which looked a lot like Solar Cycle 21. Cycle 22 peaked around 1991-1992, with a more pronounced double peak. The formerly teenaged ham was now solidly into middle age, and still wondering if sunspot activity would ever roar back to the levels of the late 1950s.
Solar Cycle 23 was another double peak, but significantly lower in 2000, 2001 and 2002 than the previous cycle, perhaps disappointing the middle-aged ham, who then sees solar activity slide into a long and low minimum over the next decade, in a way that was impossible to imagine as a teenaged ham enjoying Solar Cycle 19. The 160 meter operators -- quite happy in this situation with a much quieter Sun -- have no such longing for the active Sun of yesteryear.
The young ham of the late 1950s now contemplates the peak of Solar Cycle 24, apparently much lower than any seen in most of the past century, and expected to grow to maximum this year. Now we have many more tools to observe and measure both solar activity and propagation, and we know that activity could still increase significantly. Some foresee decades of lower activity, but of course predicting solar activity is a very tricky proposition, and anything could happen.
Click here for a comparison of recent cycles, from Solar Cycle 21 to the current Solar Cycle 24.
While we’ve seen a number of papers and predictions for a series of quieter sunspot cycles, some disagree. For instance, Michael Proctor -- Chair of Astrophysical Fluid Dynamics at Cambridge University -- is not convinced. He was quoted this year as saying that “[t]his present cycle is similar to the weak one that ended in 1913, and that was followed by a strong cycle.” Those were Solar Cycles 14 and 15, and Solar Cycle 15 was only strong relative to Solar Cycle 14. Cycles 17, 18 and 19 were stronger than 15, as were 21, 22 and 23.
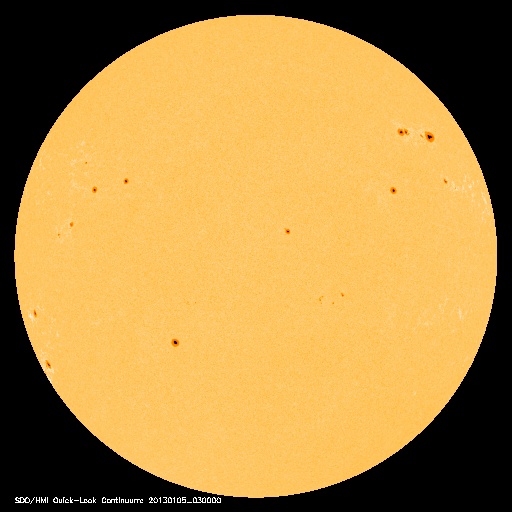
It is also important to remember there is wild variability in solar activity. To make those graphs of sunspot numbers appear smooth, each point on the graph actually represents an average of a year of data. When averaged, the flurry of solar activity at the end of 2011, as well as some future activity in 2013, could appear as a broad peak on a graph.
NASA looks frequently at their predictions for the current solar cycle and often adjusts them every month. The latest shows a smoothed sunspot number a bit lower from the forecast from several weeks ago. In its December 10 forecast, NASA predicted a smoothed sunspot number of 72 in late 2013, but that number is now 69 in its January 2 release. Note these are the lower international sunspot numbers, which are always less than Boulder numbers presented in this bulletin (see below).
With the change from 2012 to 2013, now is a good time to review sunspot numbers and trends. The average daily sunspot numbers in 2013 were up substantially from 2012. From 2004-2012, the yearly progression was 68.6, 48.9, 26.1, 12.8, 4.7, 5.1, 25.5, 29.9 and 82.3. I took all the daily sunspot numbers for 2012, added them together and the sum was 30,133. Divide that by 366 (the number of days in 2012, a leap year) and the result is approximately 82.3. In 2011, it was 10,913 divided by 365, yielding 29.9. The 2012 average was higher than any year after 2003, but at the peak of Solar Cycle 23, the averages from 1998-2003 were all higher: 88.7, 136.3, 173, 170.3, 176.7 and 109.2. It seems unlikely that average daily sunspot numbers this year will reach anywhere near the level of 2000-2002.
We observe a moving three month average of sunspot numbers in an attempt to smooth out some of the variations. Unfortunately, the past three months were much lower than the three month period ending one month earlier. The current average of 74.4 -- centered on November 2012 -- is lower than any three month period since averages centered on February and March of 2012. The three month period previous to the current one is centered on October 2012; it covers September-November with the average at 82.3. To recap averages from previous bulletins, the three month moving averages of daily sunspot numbers centered on July 2011-November 2012 were 63, 79.6, 98.6, 118.8, 118.6, 110, 83.3, 73.7, 71.2, 87.3, 91.5, 96.5, 91.9, 89.9, 81.2, 82.3 and 74.4.
Sunspot numbers for December 27-January 2 were 78, 54, 49, 37, 87, 99 and 90, with a mean of 70.6. The 10.7 centimeter flux was 106.8, 105.8, 104.3, 106.7, 113.6, 117.8 and 119, with a mean of 110.6. The estimated planetary A indices were 1, 2, 3, 4, 2, 1 and 3, with a mean of 2.3. The estimated mid-latitude A indices were 0, 2, 3, 4, 1, 1 and 2, with a mean of 1.9.
Looking at the past week, we saw a sizable gain in solar flux yesterday, when the value went from 106.7, 113.6, 117.8 and 119 to 128.8 on December 30-January 3. NOAA and USAF predict solar flux at 130 on January 4-6, 125 and 120 on January 7-8, 115 on January 9-10, 110 on January 11, 105 on January 12-13, 110 on January 14-17, 115 on January 18-20, and rising again to 120 on January 21-23. The predicted planetary A index is 5 on January 4-12, 10 on January 13, 5 on January 14-25 and back up to 8 on January 26.
All times listed are UTC, unless otherwise noted.
Amateur solar observer Tad Cook, K7RA, of Seattle, Washington, provides this weekly report on solar conditions and propagation. This report also is available via W1AW every Friday, and an abbreviated version appears each Thursday in The ARRL Letter. You can find a guide to articles and programs concerning propagation here. Check here and here for a detailed explanation of the numbers used in this bulletin. An archive of past propagation bulletins can be found here. You can find monthly propagation charts between four USA regions and 12 overseas locations here. Readers may contact the author via e-mail.
Photo Gallery
Back


