The K7RA Solar Update
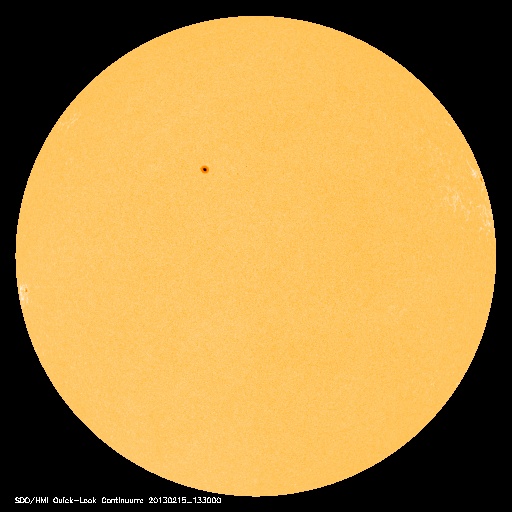
Solar activity continues at the low levels that we have seen in the past few weeks. The sunspot numbers have been remarkably consistent, with the average daily numbers for the weeks since January 17 at 56.4, 55.7, 50.7 and finally 51.3 for this past week. As you can see, the average daily sunspot number rose less than 1 point from the previous week to the past week, while the average daily solar flux receded 2.4 points to 104. Geomagnetic conditions remain calm.
Sunspot numbers for February 7-13 were 58, 57, 58, 45, 60, 55 and 26, with a mean of 51.3. The 10.7 centimeter flux was 102.8, 104.2, 107.6, 105.9, 105.2, 101.8 and 100.3, with a mean of 104. The estimated planetary A indices were 6, 7, 3, 4, 4, 4 and 11, with a mean of 5.6. The estimated mid-latitude A indices were 7, 8, 3, 3, 3, 3 and 9, with a mean of 5.1.
This weekend is the CW portion of the ARRL DX International Contest. Conditions will probably be about the same as last year, because solar activity is about the same as it was in 2012. The latest prediction for solar flux shows values of 100 for February 15-16, 105 on February 17-19, 100 on February 20-22, 115 on February 23-24, 110 and 105 on February 25-26, 100 on February 27-March 3, 95 on March 4-9, and rising to 115 on March 10 and 120 on March 11-13. The predicted planetary A index is 5 on February 15-20, 9 on February 21-22, 8 on February 23, 5 on February 24-28, then 10 and 8 on March 1-2, and back down to 5 on March 3-17.
Don’t miss the article in the March issue of QST, by Carl Luetzelschwab, K9LA titled “The Sun and the Ionosphere.” It begins on page 48, gives an update on Solar Cycle 24 and discusses measuring the Sun and ionosphere and relating the solar flux to the MUF, or Maximum Usable Frequency.
Neil Shapiro, W2NLS, of Bethpage -- which is on New York’s Long Island -- asked about relating the information in these bulletins to practical on-the-air results. I suggested that he check out the resources listed at the bottom of each bulletin from the ARRL Technical Information Service, as well as the resources from the K9LA website. One useful tool is to download the free program W6ELprop (which works on the Windows operating system); you will need to enter your latitude and longitude for you default station location. A useful tool for converting street addresses to geographical coordinates can be found here.
The engine used for driving W6ELprop was originally designed to work with the predicted smoothed sunspot number for the month, and it doesn’t really work well to try to use the latest day’s numbers. So an average for the past 5 days is a compromise. You can use an average of the previous 5 days sunspot numbers found here. For the K index, either use the latest Middle Latitude numbers from the Space Weather Prediction Center (SWPC) or use the planetary number from WWV.
I ran the numbers for Neil on February 15, from Bethpage to the Czech Republic. It looks like 15 meters is a good bet from 1430-1700, and 17 and 20 meters from 1330-1800 (but it looks like there are stronger signals on 17 meters, assuming power levels and antennas are equal). It looks like 30 meters should open up around 1800 and have the strongest signals from 2130-0100, while 40 meters should be good from 2000-1000, with the best signals around 2230-0630.
An alternative to sunspot numbers would be to use the solar flux. You can set W6ELprop to default to either type, or change it on the fly by entering F103 (for example) as the solar flux of 103, or S66 as the sunspot number of 66.
Another useful tool is a new one from Stu Phillips, K6TU, of Woodside, California, found here. This one is interesting. You subscribe to this service (a 30-day free trial is available) and tell it what kind of prediction you want to run. Then, after making the calculations, it e-mails a link that you use to display them. You can step through hour by hour to see maps for each band that show where your signals will be strongest, with different colors used to express different signal levels. It is interesting to see how the coverage areas shift, hour by hour.
We heard from Peter Thulesen, OX3XR, in Nuuk, Greenland. He wrote: “I’d like to report my observations on 28 MHz propagation from Greenland (grid GP44) to the US and Canada in the evenings after sunset here in Greenland. In January, around 2000-2200, I very often have worked quite a few stations on 28 MHz CW, all from the US and Canada. In the weekends -- where I have the possibility to monitor the bands during the day -- 28 MHz seems to be more dead towards the US and Canada than in the evening just after sunset. In the evening after sunset, 28 MHz seems dead as I listen on the band; however, after calling CQ a few times around 28.025 MHz, those US and Canadian stations start to answer my call. The signal strength is good up to 599 with stable signals and only little fading. When conditions have dropped for CW contacts, I can normally continue working JT65 stations on 28 MHz for another 30-45 minutes. I’m using a sloping dipole toward Europe and 100 W.”
Jeff Hartley, N8II, of Shepherdstown, West Virginia, wrote: “The seasonal changes we expect on the bands are occurring. Long path propagation has disappeared on 30 meters into Southeast Asia, and the evening openings are much improved on 12-20 meters into East Asia. We get Japanese stations some nights in the 2200 hour on 12 meters -- and 15 is even better -- and on 20 meter CW, the stations in Mongolia, such as JT1AA/3 and JT1E, are much louder around 0100, along with good openings to Asiatic Russia which were almost nil in mid-January. Conditions have been quite good at times into Central Asia on the low bands. I logged 4S7NE in Sri Lanka on 40 meter CW on February 8 around 0125. T6LG in Afghanistan continues to be active on 80 meter CW, and in Tajikistan, EY8MM was also heard around their sunrise.”
All times listed are UTC, unless otherwise noted.
Amateur solar observer Tad Cook, K7RA, of Seattle, Washington, provides this weekly report on solar conditions and propagation. This report also is available via W1AW every Friday, and an abbreviated version appears each Thursday in The ARRL Letter. You can find a guide to articles and programs concerning propagation here. Check here and here for a detailed explanation of the numbers used in this bulletin. An archive of past propagation bulletins can be found here. You can find monthly propagation charts between four USA regions and 12 overseas locations here. Readers may contact the author via e-mail.
Photo Gallery
Back


