The K7RA Solar Update
Solar activity made a healthy jump over the past week, with the average daily sunspot numbers up more than 30 points to 120.9, while the average daily solar flux increased more than 27 points to 136.5. The most active day for geomagnetic indices was May 1, when the planetary A index reached 21 and the high-latitude College A index (measured near Fairbanks, Alaska) was a whopping 57. That number has been higher, but only twice in the past six months, when it was 64 on March 1 and 79 on March 17.
Sunspot numbers for April 25-May 1 were 93, 104, 100, 97, 136, 165 and 151, with a mean of 120.9. The 10.7 centimeter flux was 119.2, 121.9, 127, 131.7, 142.4, 154.4 and 159.2, with a mean of 136.5. The estimated planetary A indices were 8, 17, 6, 5, 5, 7 and 21, with a mean of 9.9. The estimated mid-latitude A indices were 14, 18, 6, 4, 5, 6 and 16, with a mean of 9.9.
The latest forecast has the solar flux at 155 on May 3-4, 150 on May 5-6, 145 on May 7-9, then 140, 125 and 120 on May 10-12, 125 on May 13-15, 120 on May 16-17, then 125, 120, and 130 on May 18-20, 135 on May 21-22 and back down to 130 for May 23-24. The predicted planetary A index is 8 on May 3-4, 12 on May 5, 8 on May 6, 5 on May 7-20, then 15, 10 and 15 on May 21-23, and then back down to 5 through June 16.
On May 1, NASA released a new solar cycle prediction, but it wasn’t really new. These predictions arrive at the start of every month, and they have remained the same since March 1 when NASA’s prediction for the smoothed International Sunspot Number at the cycle peak shifted from 69 to 66 for fall 2013.
It’s time to review our three-month moving average of sunspot numbers, which has increased. The average daily sunspot number for February, March and April was 85.2. The average daily sunspot numbers for the three-month periods centered on September 2012-March 2013 were 81.2 (August-October 2012), 82.3 (September-November 2012), 74.4 (October-December 2012), 82.8 (November 2012-January 2013), 73.6 (December 2012-February 2013), 80.7 (January-March 2013) and 85.2 (February-April 2013). The average sunspot number for the month of April was 112.8, for March it was 81.1, and it was 60.1 in February.
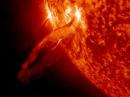
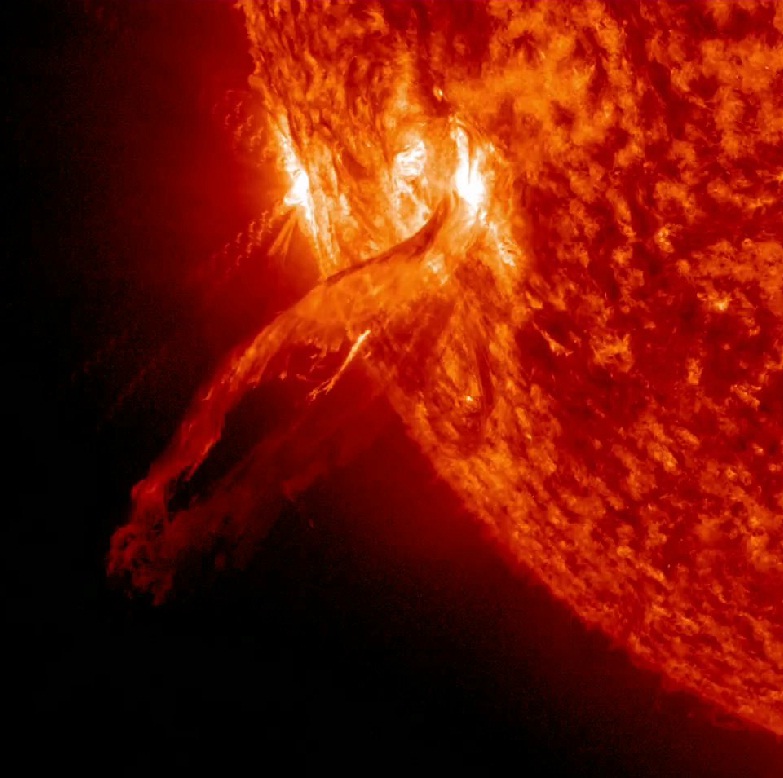
Eric Ferguson, VE3CR, of Burlington, Ontario, wondered why there are no solar flares at the Sun’s poles. I passed this question on to Robert Steenburgh, KA8JBY, who is a Senior Space Weather Forecaster at the NOAA Space Weather Prediction Center. “Flares are thought to originate from the deformation of magnetic field lines which break and reconnect,” he said. “There is a latitudinal band in which this magnetic flux emergence (and hence sunspot formation) and deformation occurs. Sunspots typically form at mid-latitudes (equatorward of around 40 degrees) at the beginning of the solar cycle, and the breeding grounds drift toward the equator over the course of the cycle. This behavior is attributed to the solar dynamo. There were four flares identified poleward of 50 degrees latitude, out of a total of 20,186. The poles are usually dominated by coronal holes and ‘open’ magnetic field lines that extend out into the heliosphere. So the mechanisms for flare formation are generally absent.”
Mike Snyder, KN8J, who lives a few miles south of Harrisville, West Virginia in grid square EM99lf, wrote on May 3: “My wife and I are early risers, usually up about 3 AM. Generally speaking, 3-5 AM produces some fair DX for me. Lately, it’s been getting a bit better on the 20 and 30 meter bands. The South Pacific is usually open at these hours. I’ve managed a couple QRP contacts with Hawaii. I’ve noticed parts of Europe open as well. I had a solid contact with OK1HB from the Czech Republic on 14.062MHz. I was running 100 W barefoot for this one. This morning, I finally worked a new one: A35JP in Tonga on 14.003MHz.”
All times listed are UTC, unless otherwise noted.
Amateur solar observer Tad Cook, K7RA, of Seattle, Washington, provides this weekly report on solar conditions and propagation. This report also is available via W1AW every Friday, and an abbreviated version appears each Thursday in The ARRL Letter. You can find a guide to articles and programs concerning propagation here. Check here and here for a detailed explanation of the numbers used in this bulletin. An archive of past propagation bulletins can be found here. You can find monthly propagation charts between four USA regions and 12 overseas locations here. Readers may contact the author via e-mail.
Photo Gallery
-
 Active sunspot re...
Back


