The K7RA Solar Update
Solar activity slipped this week, with the average daily sunspot number declining nearly 50 points to 77 and average daily solar flux down nearly 10 points to 116.4. In fact, those “nearly” numbers were 49.9 and 9.9.
The latest solar flux predictions from NOAA/USAF (Thursday, August 29, 2013):
August 30-September 1: 108, 105 and 108
September 2-3: 110
September 4-5: 112
September 6-7: 115 and 120
September 8-14: 125
September 15: 120
September 16-17: 115
September 18: 110
September 19-21: 105
September 22-23: 110, 105
September 24-25: 100
Until August 27-28, the forecast had solar flux dropping below 100 on August 30 through September 2, but the outlook was upgraded for this period. But flux values are predicted to drop below 100 on September 26-28 (95, 90, 90, respectively).
Predicted planetary A index:
August 30-31: 20
September 1: 12
September 2-3: 5
September 4: 8
September 5-9: 5
September 10-12: 10, 15, 18
September 13-14: 8
September 15-16: 5
September 17-19: 12, 18 and 15
September 20-21: 5
September 22-23: 12, 8
September 24-26: 5
Every day — typically between 2100 and 2200 UTC — an update of all these above data becomes available. Today the August 29 prediction was revised and re-released at 0839 UTC today, about 11 hours after the earlier version. The numbers reported here did not change, however.
Much talk lately has centered around a possible dual peak in the current solar cycle. This would follow a pattern established in recent solar cycles. If this is so, the first peak probably occurred in the fall of 2011. Now it appears that perhaps the second peak was in spring 2013.
We are just a day away from the end of the month, so we won’t see the actual averages until next week, but we can get a pretty close reading knowing the actual numbers for 29 of the 31 days in August.
The average daily sunspot number for the first 29 days of August was 92.2. This is above the levels for June and July, 80.2 and 86.2, but lower than April and May. This also pegs the three-month average of daily sunspot numbers (centered on July) at around 86.1, based on data from 90 of the 92 days in that period. This is higher than all of the three-month moving averages centered on September 2012 through March 2013, but lower than the previous three periods centered on April and May (106.4) and 97.5 for June.
The two stand-out periods were both when the three-month moving average was above 100. Those were centered on October through December 2011 (118.8, 118.6 and 110) and April and May of this year, when average for both months was 106.4.
We began tracking a three-month moving average in early 2007, in the February 9 bulletin and have continued in each or the 78 months since then. For those unfamiliar with this concept, a moving average is used to smooth out the day-to-day variations in noisy data to make it easier to spot trends. If you wanted to create a 30-day moving average of any data, such as stock prices, temperature or sunspot numbers, you would add all the numbers for the previous 29 days to today’s value, then divide by 30. Tomorrow you would drop off the first number in the series and include tomorrow’s number. This continues, day after day, and what emerges is a graph that smoothes out day-to-day variations, making it easier to spot trends.
Because this bulletin was always text-based (47 years ago as a child, I copied my predecessor’s weekly propagation bulletins in Morse code from W1AW), I needed a simple way to present a moving average without the aid of graphics, in order to spot trends in the upcoming cycle. In this simple method, I would do an arithmetic average (adding all the daily sunspot numbers, then dividing by the number of days) for a three-month period.
On the first day of April I would add all the numbers from January 1 through March 31, then divide by 91 in a leap year, and 90 in all other years. This reveals an average either described as centered on February, or the period ending in March.
On May 1 I could average all the data for February through April, so every month, one old month drops off, and a new month is added. Wikipedia has a page explaining this, and you can see there are many ways to slice and dice the data.
Next week when we will present the data described above, we will see the two peaks and the decline since then.
For some reason (it’s summer?) there were no reports from readers this week.
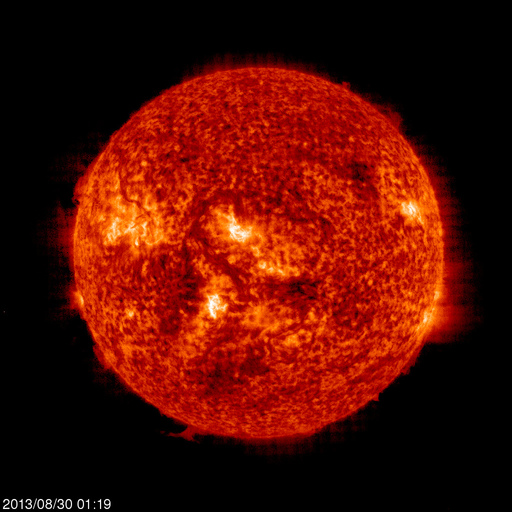
I haven’t looked at this site in a long time, and I see it has added many attractive and useful features. Note the fantastic images under the Active Solar Regions heading. If you click on the image, it will take you to a more detailed picture, such as this one. You can then hack that URL to see a series of images of successive days. Note the date in this URL is for 8-29-2013, expressed here as /AR_CH_20130829_hres.jpg. You can change it to 20130828, 20130827, etc, then use the back-forward button on your web browser to see the images from successive days, along with the solar rotation.
Sunspot numbers for August 22 through 28 were 125, 127, 101, 46, 35, 61, and 44, with a mean of 77. The 10.7 cm flux was 131.6, 124.1, 117.4, 112.6, 111.2, 109.7, and 108.1, with a mean of 116.4. Estimated planetary A indices were 13, 15, 7, 7, 5, 15, and 9, with a mean of 10.1. Estimated mid-latitude A indices were 11, 14, 8, 7, 4, 12, and 8, with a mean of 9.1.
For more information concerning radio propagation, see the ARRL Technical Information Service page on the topic. For an explanation of the numbers used in this bulletin, see this article on the ARRL website, “What the Numbers Mean, and Propagation Predictions — a brief introduction to propagation and the major factors affecting it,” by Carl Luetzelschwab, K9LA.
The ARRL website contains an archive of past propagation bulletins. More good information and tutorials on propagation are on K9LA’s website. The ARRL website posts monthly propagation charts between four US regions and 12 overseas locations.
See the instructions for starting or ending e-mail distribution of ARRL bulletins.
Photo Gallery
Back


