The K7RA Solar Update
Solar and geomagnetic activity slackened over the past week, with average daily sunspot numbers declining from 202.7 to 73.4, and average daily solar flux dropping from 160.4 to 122.6.
The latest outlook has solar flux at 125 on May 2, 130 on May 3, 135 on May 4-6, 140 on May 7-9, 150 on May 10-13, 145 on May 14, 140 on May 15-17, 135 on May 18, 130 on May 19-20, and 125 on May 21. It then reaches a low of 115 on May 24-25, then bounces back to 140 on May 31, and looking way, way out, 184 on June 9. But June 9 is 37 days out, perhaps too far to rely on a forecast.
Predicted planetary A index is 5 on May 2, 8 on May 3-4, 5 on May 5-13, 10 and 8 on May 14-15, and 5 on May 16-20, 10 and 8 on May 21-22, 5 on May 23-25, and 8 on May 26-27.
With April now over, we can look at the 3-month moving average of daily sunspot numbers centered on March. Even with the softening of activity over the past week, the moving average is higher than ever for this solar cycle, demonstrating that this second (or third) peak is stronger than the first.
According to our moving average, the first peak was in the two 3-month periods centered on October and November 2011, when the average daily sunspot numbers were 118.8 and 118.6. There was another slightly weaker peak centered on April and May of 2013, at 106.4 in both periods.
The averages following that period, centered on June 2013 through March 2014 were 97.5, 85.6, 77.4, 91.2, 102.9, 123.7, 123.3, 138.5, 146.4 and 148.2. This includes daily sunspot data from May 1, 2013 through April 30, 2014. At the end of every month the most recent month of data is added in, and the data from four months back is dropped off, so we get a smoother set of numbers to look at. When you see those graphs of smoothed sunspot numbers, each point on the graph represents a year of data. The three-month moving average is a bit more responsive.
F.K. Janda, OK1HH, predicts quiet geomagnetic conditions May 2, active to disturbed conditions May 3, quiet to unsettled May 4, quiet to active May 5, quiet on May 6, quiet to unsettled May 7, quiet May 8-9, active to disturbed May 10, quiet to active May 11-12, mostly quiet May 13-16, quiet to unsettled May 17-18, quiet to active May 19, mostly quiet May 20-21, quiet to active May 22-23, mostly quiet May 24, quiet May 25-27, quiet to unsettled May 28, and quiet to active May 29.
Jon Jones, N0JK, notes that on May 1 there were interesting 6 meter E-skip and TEP openings for both Europe and Eastern North America. “It looks like the Es - TEP was open from 2000 UTC to 2230 UTC May 1. I see VE1, VE9, W1, W2, W3, W8 and W9 spotted CE, LU and PY during that period on 6 meters. There were Es spotted from W1 to HI and KP4, and VP9 to W4. PY2AB worked W1AW/1 at 2046 UTC!
VE9DX AND PA2RU spotted the ZD8VHF/b at 2101 UTC. Open from Europe and the eastern USA and Canada to South Atlantic and America at the same time.”
Robert Miles, K9IL, of Martin, Tennessee says for a 30 meter beacon to check propagation, he likes to use a German RTTY station on 10.1005 MHz. When the signals are S9, he knows that propagation to Europe and sometimes long path to Japan should be good.
Bob Liddy, K8BL, of Mentor, Ohio wrote on April 26: “I had an experience with the ‘Dead Band Syndrome’ yesterday. Since the beginning of the ARRL Centennial QSO Party, I've been on the WARC bands looking for QSO points and trying to finish up WAS on those three bands. I'll often tune across these bands and try to get an idea of what activity was taking place, if any.
“On 4/25, I tuned across 12 meters and only heard a couple of weak signals, so I decided to roll the dice and see what might happen. At 2200Z, I put out a CQ on 12 meter CW using 400 W and my homebrew 12/17 rotatable V dipole.
“Little did I imagine that I'd qualify for Worked All Continents in less than 40 minutes by calling CQ on a seemingly dead band! At 2200Z I was immediately called by ZL4PLM for Oceania. This was followed by NN4R at 2201 for North America, at 2203 by G7BXU for Europe, at 2212 by JJ1IRS for Asia, at 2220 by PY1CMT for South America and at 2239 by EA8YV for Africa. Also, HZ1BH/QRP called in at 2225 for the other end of Asia!
“The solar numbers at the time were SFI-125, A-9 and K-2. These didn't look like great DX numbers, but the stations were there and heard me well enough to answer my CQs. Working WAC on a supposedly ‘Dead Band’ in less than 40 minutes by calling CQ definitely amazed me! It makes me wonder what activity would be like if folks would give some Bands a try even though a quick scan turned up nothing.”
Interesting, and good advice, Bob!
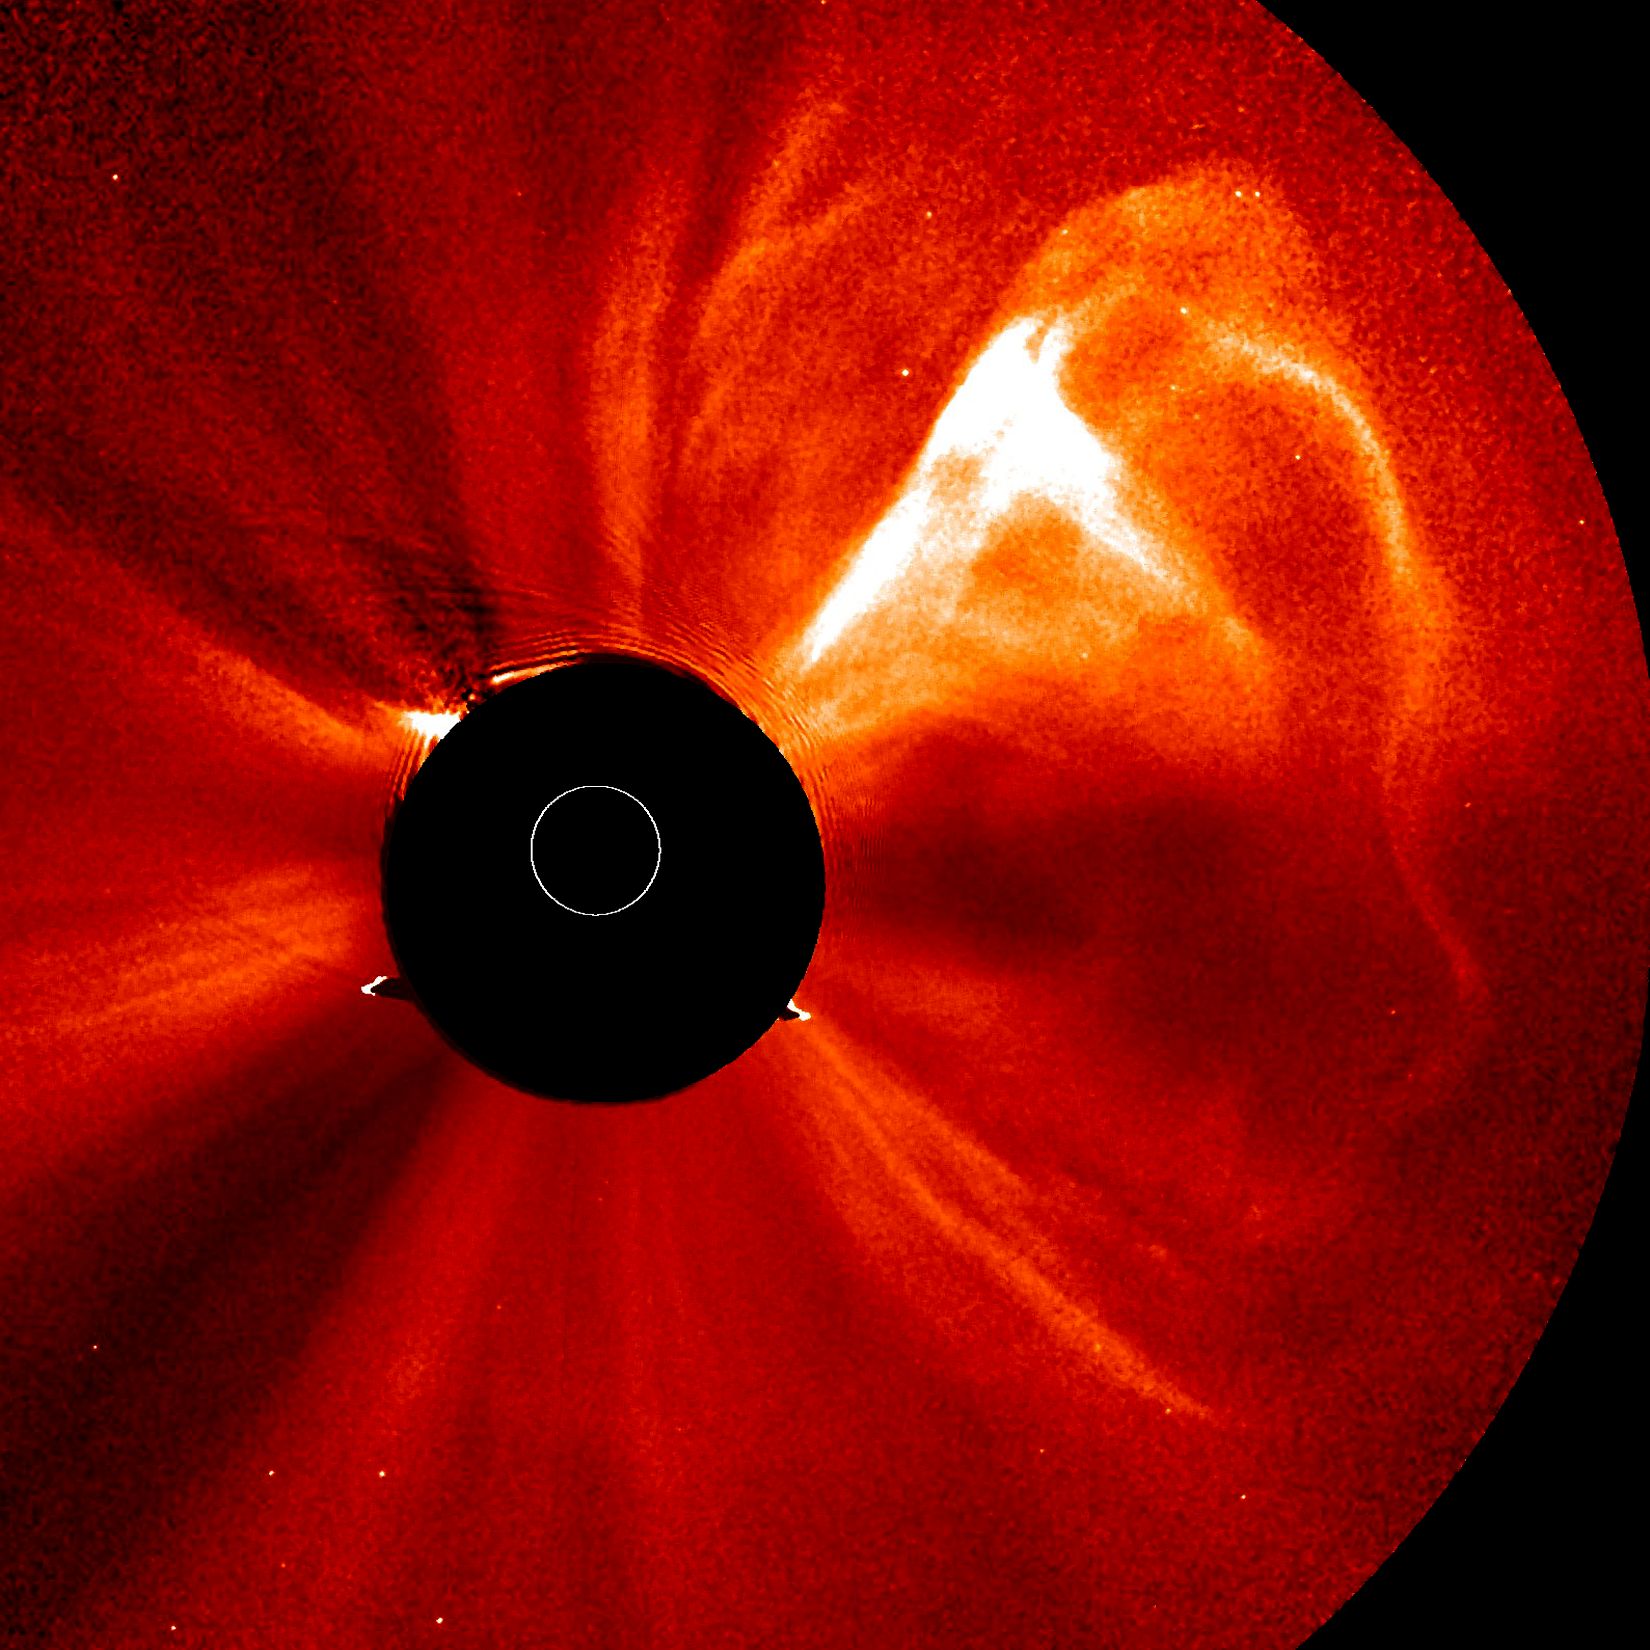
Dan Eskenazi, K7SS, asked about the typical beamwidth of a coronal mass ejection. He was thinking about that monster flare on July 23, 2012 that fortunately missed us. I wrote about it in the ARLP012 bulletin (see http://www.arrl.org/w1aw-bulletins-archive/ARLP012/2014 ).
I suspected that CME beam widths vary quite a bit, and I put the question to a couple of experts. Carl Luetzelschwab, K9LA, mentioned an old Journal of Geophysical Research paper analyzing 241 CMEs from 1979 to 1981 (the peak of solar cycle 21) for angular span. They ranged from 2 degrees to over 120 degrees, with the average at 45 degrees, and median at 30 degrees.
Carl just sent me more information from an early 1980s analysis of 1209 CMEs, showing average angular width at 47 degrees, and median at 44 degrees.
Robert Steenburgh, KA8JBY, is a NOAA Space Weather Forecaster, and he said that on July 23, 2012 there were three CMEs, “The largest had an angular width of 190 degrees, followed by a 132 degree event.”
He referred me to Cactus, a system for computer aided CME tracking which analyzes data from LASCO, the Large Angle and Spectrometric Coronagraph Experiment. See http://lasco-www.nrl.navy.mil/index.php.
For information on Cactus, see http://sidc.oma.be/cactus/ .
The site at http://sidc.oma.be/cactus/catalog/LASCO/2_5_0/2012/07/latestCMEs.html has July 2012 data on CMEs, and this has a great deal of detailed information. Anything in color on this page is a clickable link to data on each CME, including a movie you can download. You can go to July 23 and watch the movies for each of the three CMEs on that date. As you will see, each of these were huge events. These were aimed directly at Earth’s orbit, but Earth was not in position on that date. A few days difference (I don’t know whether it was too early or too late) and our fragile electrical grid and vulnerable telecommunications infrastructure would have been in very deep trouble.
For more information concerning radio propagation, see the ARRL Technical Information Service at http://arrl.org/propagation-of-rf-signals. For an explanation of the numbers used in this bulletin, see http://arrl.org/the-sun-the-earth-the-ionosphere. An archive of past propagation bulletins is at http://arrl.org/w1aw-bulletins-archive-propagation. More good information and tutorials on propagation are at http://k9la.us/.
Monthly propagation charts between four USA regions and twelve overseas locations are at http://arrl.org/propagation.
Instructions for starting or ending email distribution of ARRL bulletins are at http://arrl.org/bulletins.
Sunspot numbers for April 24 through 30 were 71, 73, 46, 84, 79, 80, and 81, with a mean of 73.4. 10.7 cm flux was 130.1, 124.7, 120.7, 118.1, 120.8, 120.1, and 123.6, with a mean of 122.6. Estimated planetary A indices were 10, 9, 6, 4, 6, 6, and 18, with a mean of 8.4. Estimated mid-latitude A indices were 8, 7, 8, 4, 7, 7, and 12, with a mean of 7.6.
Photo Gallery
Back


