The K7RA Solar Update
This bulletin is a day early, as Friday is the day the United States celebrates its independence from the British Empire. Next week we will be back on the regular schedule.
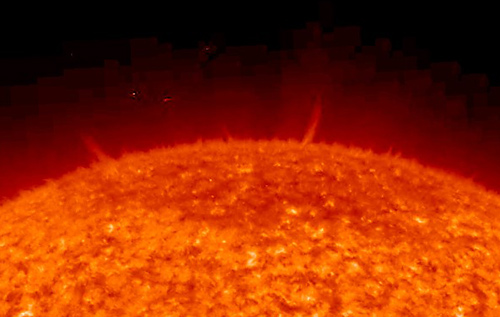
The Earth-facing side of our Sun is suddenly crowded with clusters of sunspots, so this cycle definitely is not over. Over the past week average daily sunspot numbers rose 43.3 points to 115.6, while average daily solar flux was up 30.7 points to 129.5. The 45 day outlook has also improved markedly. Back in mid-June the predicted average solar flux for the next reporting period (July 3-9) was only 137.9. By June 26 the increasingly pessimistic forecast had dropped to only 128.6 for those same dates. But yesterday, July 2, the predicted average daily solar flux for July 3-9 rose to 177.9.
June has ended, so now is the time to look at our 3-month moving average of sunspot numbers. A month ago we looked at an average of daily sunspot numbers running from March 1 to May 31, and now this time we calculate the average from April 1 to June 30. Starting a year ago, with the trailing 3-month average ending in June 2013, the average daily sunspot numbers were 106.4, 97.5, 85.6, 77.4, 91.2, 102.9, 123.7, 123.3, 138.5, 146.4, 148.2 129.6 and 118.4. So using this method, the recent peak was centered on February and March of this year at 146.4 and 148.2. An earlier peak centered on April and May 2013 was 106.4 during both periods, and the earlier peak was 118.8 and 118.6 centered on October and November 2011. I really think this cycle has three peaks, but perhaps the official 12 month moving average will show something else and smooth out that 2013 peak.
The latest short term prediction shows solar flux at 175 on July 3, 180 on July 4-7, 175 on July 8-9, 170, 165 and 150 on July 10-12, 130 on July 13-15, 110 on July 16-17, 115 on July 18, then solar flux declines to 90 on July 23-24, rises to 165 on August 7 and declines to 100 on August 15-16, but that is more than six weeks from now.
Predicted planetary A index is 5 on July 3-5, 8 on July 6-7, 5 on July 8-10, 8 on July 11, 5 on July 12-13, then 8, 12, 8, and 8, on July 14-17, and 5 on July 18-28, before rising to 8 again.
You can get a daily update of the 45 day outlook for solar flux and planetary A index at http://www.swpc.noaa.gov/ftpmenu/forecasts/45DF.html. These are usually updated between 2100-2130 UTC, but on July 1 the forecast was not released until 0409 UTC the following day, or the evening of July 1 in most of North America.
Scientific American is running another article on that citizen science project in which volunteers are asked to look at a series of pairs of sunspot images, and decide which of each two are more complex. Read about it at http://www.scientificamerican.com/citizen-science/zooniverse-sunspotter/.
Jon Jones, N0JK (EM28), reported on June 28 “From 0030-0145z June 21 (Sunday evening) 2 meters opened for sporadic E from KS/NE/IA to VA, NY, PA, NC, SC, etc. I heard but did not work K1HTV FM18 on 2 meters with an indoor loop antenna. A severe thunderstorm was occurring here during the opening. N0IRS EM29 worked KN4SM FM16 who was using an indoor whip and 10 watts on 144.200 MHz. This is the same time frame as N8II's 6 meter report in last week’s propagation bulletin. The short skip on 6 meters he worked is consistent with a high MUF that supported 2 meter Es.”
David Moore sent a link to an article concerning phenomena called solar rain: http://www.sciencealert.com.au/news/20142506-25744-2.html.
The New York Times ran an article which mentions Dikpati’s prediction that we were all excited about some years back, predicting a huge Cycle 24. Turns out part of her prediction was correct, just not the magnitude part. Read it here: http://www.nytimes.com/2014/07/01/science/a-solar-show-with-mixed-reviews.html.
Pete Corp, K2ARM, of Fort Edward, New York on July 1 wrote: “The last time I wrote on May 22nd we were having a couple of nice openings, but for me, 200 miles north of NYC, propagation went downhill especially for 6 meters. One evening on 15 meters I only found one JA station and worked him for around 20 minutes and after looking around I found that we were the only 2 stations on. Conditions were not good even on 15 meters.
“There have been openings on 6 meters almost every day since May 24th but almost all the openings have been for the stations running high power with good antennas. The rest of North America especially the South and West have been working Europe, Japan and South America. I worked a few stations in North America on 5/31, 6/9, 6/18, and 6/30 and since 6/30 the 6 meter band has been open here most of the day, from 1000Z to 2200Z here.
“I have worked a few more countries and Grids but it is rough with just a dipole and only using CW. I hear Europe and SA now so conditions are better and 15M is back to normal for a while.”
No reports came in regarding conditions over Field Day, but there were no big geomagnetic disruptions and solar flux was a bit better than expected. On Saturday afternoon I set up in a parking lot at the University of Washington for some casual operation on 20 meter CW. Like last year, I used a screwdriver antenna, but did not attempt mobile operation this time. Instead I ran two quarter wave radials, one each for 20 meters and 40 meters. Also made some 75 meter SSB contacts after the contest.
For more information concerning radio propagation, see the ARRL Technical Information Service at http://arrl.org/propagation-of-rf-signals. For an explanation of the numbers used in this bulletin, see http://arrl.org/the-sun-the-earth-the-ionosphere. An archive of past propagation bulletins is at http://arrl.org/w1aw-bulletins-archive-propagation. More good information and tutorials on propagation are at http://k9la.us/.
Monthly propagation charts between four USA regions and twelve overseas locations are at http://arrl.org/propagation.
Instructions for starting or ending email distribution of ARRL bulletins are at http://arrl.org/bulletins.
Sunspot numbers for June 26 through July 2 were 72, 78, 89, 112, 124, 154, and 180, with a mean of 115.6. 10.7 cm flux was 100, 104.2, 114.6, 125.7, 140.5, 151.8, and 169.4, with a mean of 129.5. Estimated planetary A indices were 5, 4, 6, 8, 6, 4, and 5, with a mean of 5.4. Estimated mid-latitude A indices were 7, 4, 6, 7, 7, 6, and 5, with a mean of 6.
Photo Gallery
Back


