The K7RA Solar Update
Solar activity is suddenly weakening, and yesterday, Thursday, July 17 the daily sunspot number was zero. We had no other zero sunspot days so far this year, none last year or in 2012, and only two in 2011, on January 27 and August 14.
We had 48 days with a sunspot number of zero in 2010 (although Spaceweather.com reports 51 days, and they may be correct), and 260 days with a daily sunspot number of zero in 2009. 2008 had 239 spotless days, and 2007 had 152 days with zero sunspots.
Just to revisit the deep trough of solar inactivity we emerged from a few years ago, 2006 had 70 spotless days, 2005 had just 17 days with no spots and 2004 saw only four spotless days. Prior to that we have to look way back to the twentieth century to 1998 to find any spotless days, (three) and 1997 had 57 days with zero sunspots.
We have not seen any new sunspot regions emerge since July 10 and 11, when there was a new one each day. On July 8 two new regions appeared. Prior to that we saw a new sunspot region appear each day, from July 1-6.
The short term outlook for solar flux shows a flux value of 90 on July 18-21, 95 on July 22-24, then 105, 115, 125, 135 and 140 on July 25-29, 145 on July 30-31, then it peaks at 155 on August 2, then drops to a minimum of 95 again on August 16-17.
The same forecast shows planetary A index of 5 on July 18-20, 8 on July 21-22, 5 on July 23, 8 on July 24, 5 on July 25, 8 on July 26, and 5 again on July 27 through August 9.
The average daily sunspot number for the recent seven-day reporting period (July 10-16) was only 96.9, down from 205.1 for the previous seven days. The solar flux average was 131.1, down from 193.9 a week ago.
OK1HH predicts the geomagnetic field will be quiet on July 18-19, mostly quiet July 20, quiet to active July 21, mostly quiet July 22, quiet to active July 23, mostly quiet July 24, quiet on July 25, mostly quiet July 26, quiet to unsettled July 27, quiet July 28-29, quiet to unsettled July 30-31, quiet on August 1, quiet to active August 2-3, mostly quiet August 4-5, quiet to unsettled August 6-9, quiet to active August 10-11, mostly quiet August 12, and quiet again on August 13.
Pete Corp, K2ARM, of Fort Edward, New York wrote on July 11, “I wrote last on July 1 and since then you must have had a lot of reports of great propagation on 6 and 2 meters. 6 meters has been open every day and some days for 12 hours or more. I was able to work a couple of new countries, on July 5 EA8DBM and EA8TL then on July 6 XE1AY. I have been hearing many Mexican and California stations but could never break the pile ups before and they also seem to be beaming JA but I can still hear them. Conditions are much better and some days it is hard to find a spot to call CQ on 6 meter CW.”
Jon Jones, N0JK, has some interesting comments regarding the question of 6 meter sporadic-E vs F2 layer propagation in recent bulletins. Jon wrote, “Agree it was multi-hop sporadic E, possibly with some chordal Es hops which would reduce signal loss as opposed to F2. Due to seasonal characteristics of the F-layer, F2 is almost impossible on 6 meters in the northern hemisphere during the summer despite high solar fluxes.
“EA8DBM did have an amazing signal. I worked Alex on 50.101 MHz July 5 at about 1520z from my mobile in EM28. Solid Q-5 CW signal with a whip and 100 watts. Alex made many 6 meter contacts in North America.
“The trans-Pacific tropo duct was also open July 5/6 from Hawaii to California. KH7Y made the trip up to the 8,000 foot level on Mona Loa and made numerous 144, 222 and 432 MHz contacts along the California coast.”
Emil Pocock, W3EP, of Lebanon, Connecticut wrote on July 13, “Ten meters opened to Europe by 6:00 AM local time (1000 UTC) here in Connecticut for the IARU Contest and stayed opening to the contest's end at 1200 UTC. This was quite unusual, given the season, SFI, and time of day. This unexpected opening was probably not via the usual F2 propagation, but more likely sporadic-E. A few 6-meter contacts were reported from W1, 2, and 3 to CT, I, and 4X about the same time, almost certainly sporadic-E. On 10 meters, I worked from G, F, and EA east to HA, 9A, and S5. I had the impression the opening was quite limited in geographical extent on both ends of the US-Europe path.”
Randy Crews, W7TJ, has some interesting observations about Cycle 24 and where we go from here.
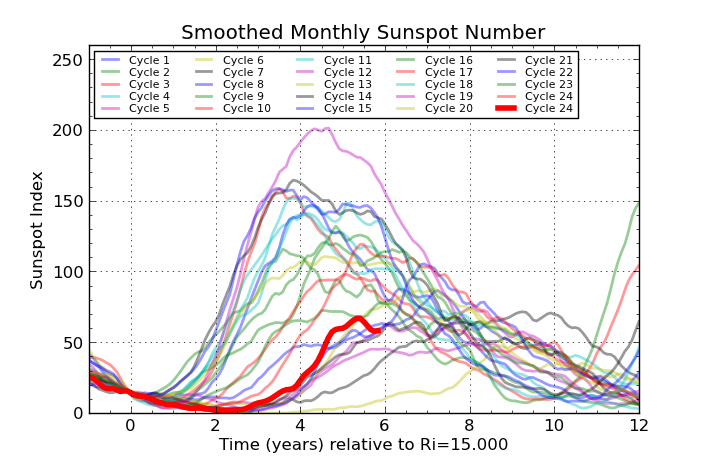
“The page at http://www.stce.be/newsletter/images/2013/19SolarCycleFC2.png clearly shows how Cycle 24 compares relative to other cycles. Note that we are at the 72 Month mark, 6 years into this Cycle. Looking at other cycles, it's easy to see Cycle 24 is reaching the end point as other cycles have done. Additionally, if a cycle starts weak (as Cycle 24 did) it will finish weak - thus far holding true to history. Speaking of starting weak, it took Cycle 24 two and one half years from the bottom in late 2008 until the solar flux climbed above 100 (February, 2011) typically the average time for this to happen is 12 months. This was the first time the solar flux reached 100 since 2005!
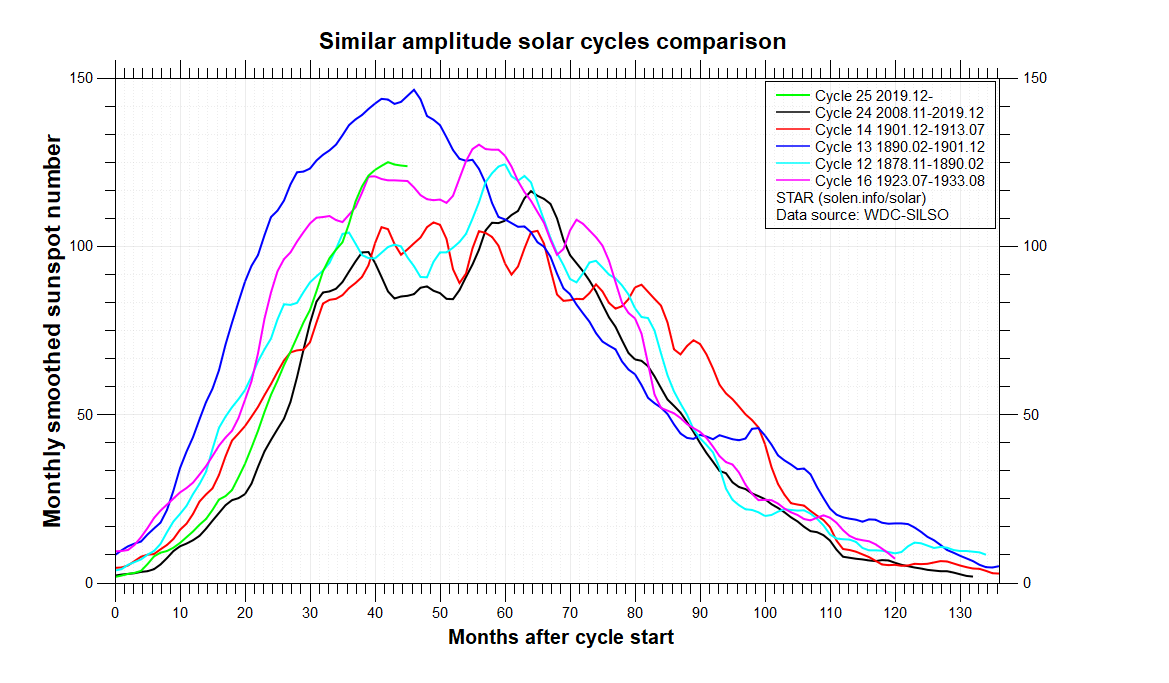
“Here is a graph of the weak cycles, 24 of course included: http://www.solen.info/solar/images/comparison_similar_cycles.png
“This cycle may not be as weak as Cycle 14, but currently it is running close to Cycles 16 and 12. See http://k9la.us/A_Look_at_All_Twenty_Three_Solar_Cycles.pdf
“This shows a nice bar graph of all cycles up to 24 provided by K9LA. Clusters of high and low cycles trend together in larger macro cycles of 40-50 years. Fitting a trend line to the graph, we are definitely on a downward trend with regard to the big picture, but also the near term outlook.
“Reference the graph on page 4 at: http://www.swpc.noaa.gov/weekly/pdf/prf2027.pdf
“Notice the wide variation between monthly highs and lows. (Solar Flux Values of 200+ and mid-90s all within a 30 day period.) This is also typical of a cycle reaching the end of its max point - wide monthly fluctuations from min to max where it previously varied maybe 1/3 of the range. (Cycle 22 had a 160 point monthly variation in January of 1991, with solar flux ranging from 200 to 360.)
“Cycle 24 had a brief peak in November of 2011, then was flat until October 2013 when the average monthly solar flux steadily climbed month after month, reaching average monthly peak of 170 in February of this year, then declining every month consistently thru June of this year.
“How much of a bounce back we have in July and subsequent months will really depend on not only the number of monthly sunspots, but also their magnetic size and complexity, which this year has been absolutely key to Cycle 24's second peak, and it's usurping the November 2011 highs.
“Conclusion: The peak of this Cycle 24 will go down to be February of 2014 as all the aforementioned data confirms. We may find Cycle 24 giving a last hurrah this fall, but it would be strictly gratis and on borrowed time.
“Livingston and Penn have it right. If the size and magnetic strength of sunspots resumes its downward trend, we will indeed have a "Propagation Winter" and Cycle 25 will be even lower.
“Also keep in mind referencing the first graph (of the weak cycles) we will have considerably lower highs from which to fall from this cycle compared to Cycles 21, 22, and 23. (Cycle 23 took 5 years, 2001 to 2006, before we entered the low portion of the cycle with solar flux values of 70-80. With Cycle 24, the fall could materialize as quickly as it began in October 2013. It will be real interesting to see how all this plays out.”
For more information concerning radio propagation, see the ARRL Technical Information Service at http://arrl.org/propagation-of-rf-signals. For an explanation of the numbers used in this bulletin, see http://arrl.org/the-sun-the-earth-the-ionosphere. An archive of past propagation bulletins is at http://arrl.org/w1aw-bulletins-archive-propagation. More good information and tutorials on propagation are at http://k9la.us/.
Monthly propagation charts between four USA regions and twelve overseas locations are at http://arrl.org/propagation.
Instructions for starting or ending email distribution of ARRL bulletins are at http://arrl.org/bulletins.
Sunspot numbers for July 10 through 16 were 159, 166, 145, 102, 70, 25, and 11, with a mean of 96.9. 10.7 cm flux was 177.4, 166.3, 145, 126.8, 109.4, 100.6, and 92.1, with a mean of 131.1. Estimated planetary A indices were 8, 6, 6, 5, 9, 7, and 5, with a mean of 6.6. Estimated mid-latitude A indices were 11, 7, 7, 6, 10, 10, and 5, with a mean of 8.
Photo Gallery
Back


