The K7RA Solar Update
For seven days from May 28 through June 3, average daily sunspot numbers dropped from 56.1 the previous week to 34.3. Average daily solar flux barely changed from 97.6 to 97.8 over the same two weeks. But both numbers show a rising trend in recent days.
Predicted solar flux is 125 on June 5, 130 on June 6, 135 on June 7-11, then 130, 120 and 110 on June 12-14, 100 on June 15-16, 95 on June 17-22, 90 on June 23-25, 95 on June 26-28, 100 on June 29, then peaking at 120 on July 7-8 and dropping back below 100 after July 13.
Predicted planetary A index is 5, 8 and 12 on June 5-7 then 15, 25 and 15 on June 8-10, then 10, 5 and 8 on June 11-13, then 15 and 12 on June 14-15, and 5 on June 16 through July 3, then 10, 25, 20 and 12 on July 4-7.
OK1HH predicts the geomagnetic field will be quiet to unsettled June 5, quiet to active June 6-9, disturbed on June 10, quiet to unsettled June 11, mostly quiet June 12, quiet on June 13, active to disturbed June 14, quiet to active June 15-16, quiet on June 17-21, quiet to unsettled on June 22-25, quiet to active June 26, active to disturbed June 27, quiet June 28-30, and mostly quiet on July 1.
OK1HH predicts increasing solar wind on June 12, June 16-17 and June 27-28, with reduced prediction reliability during the latter two periods.
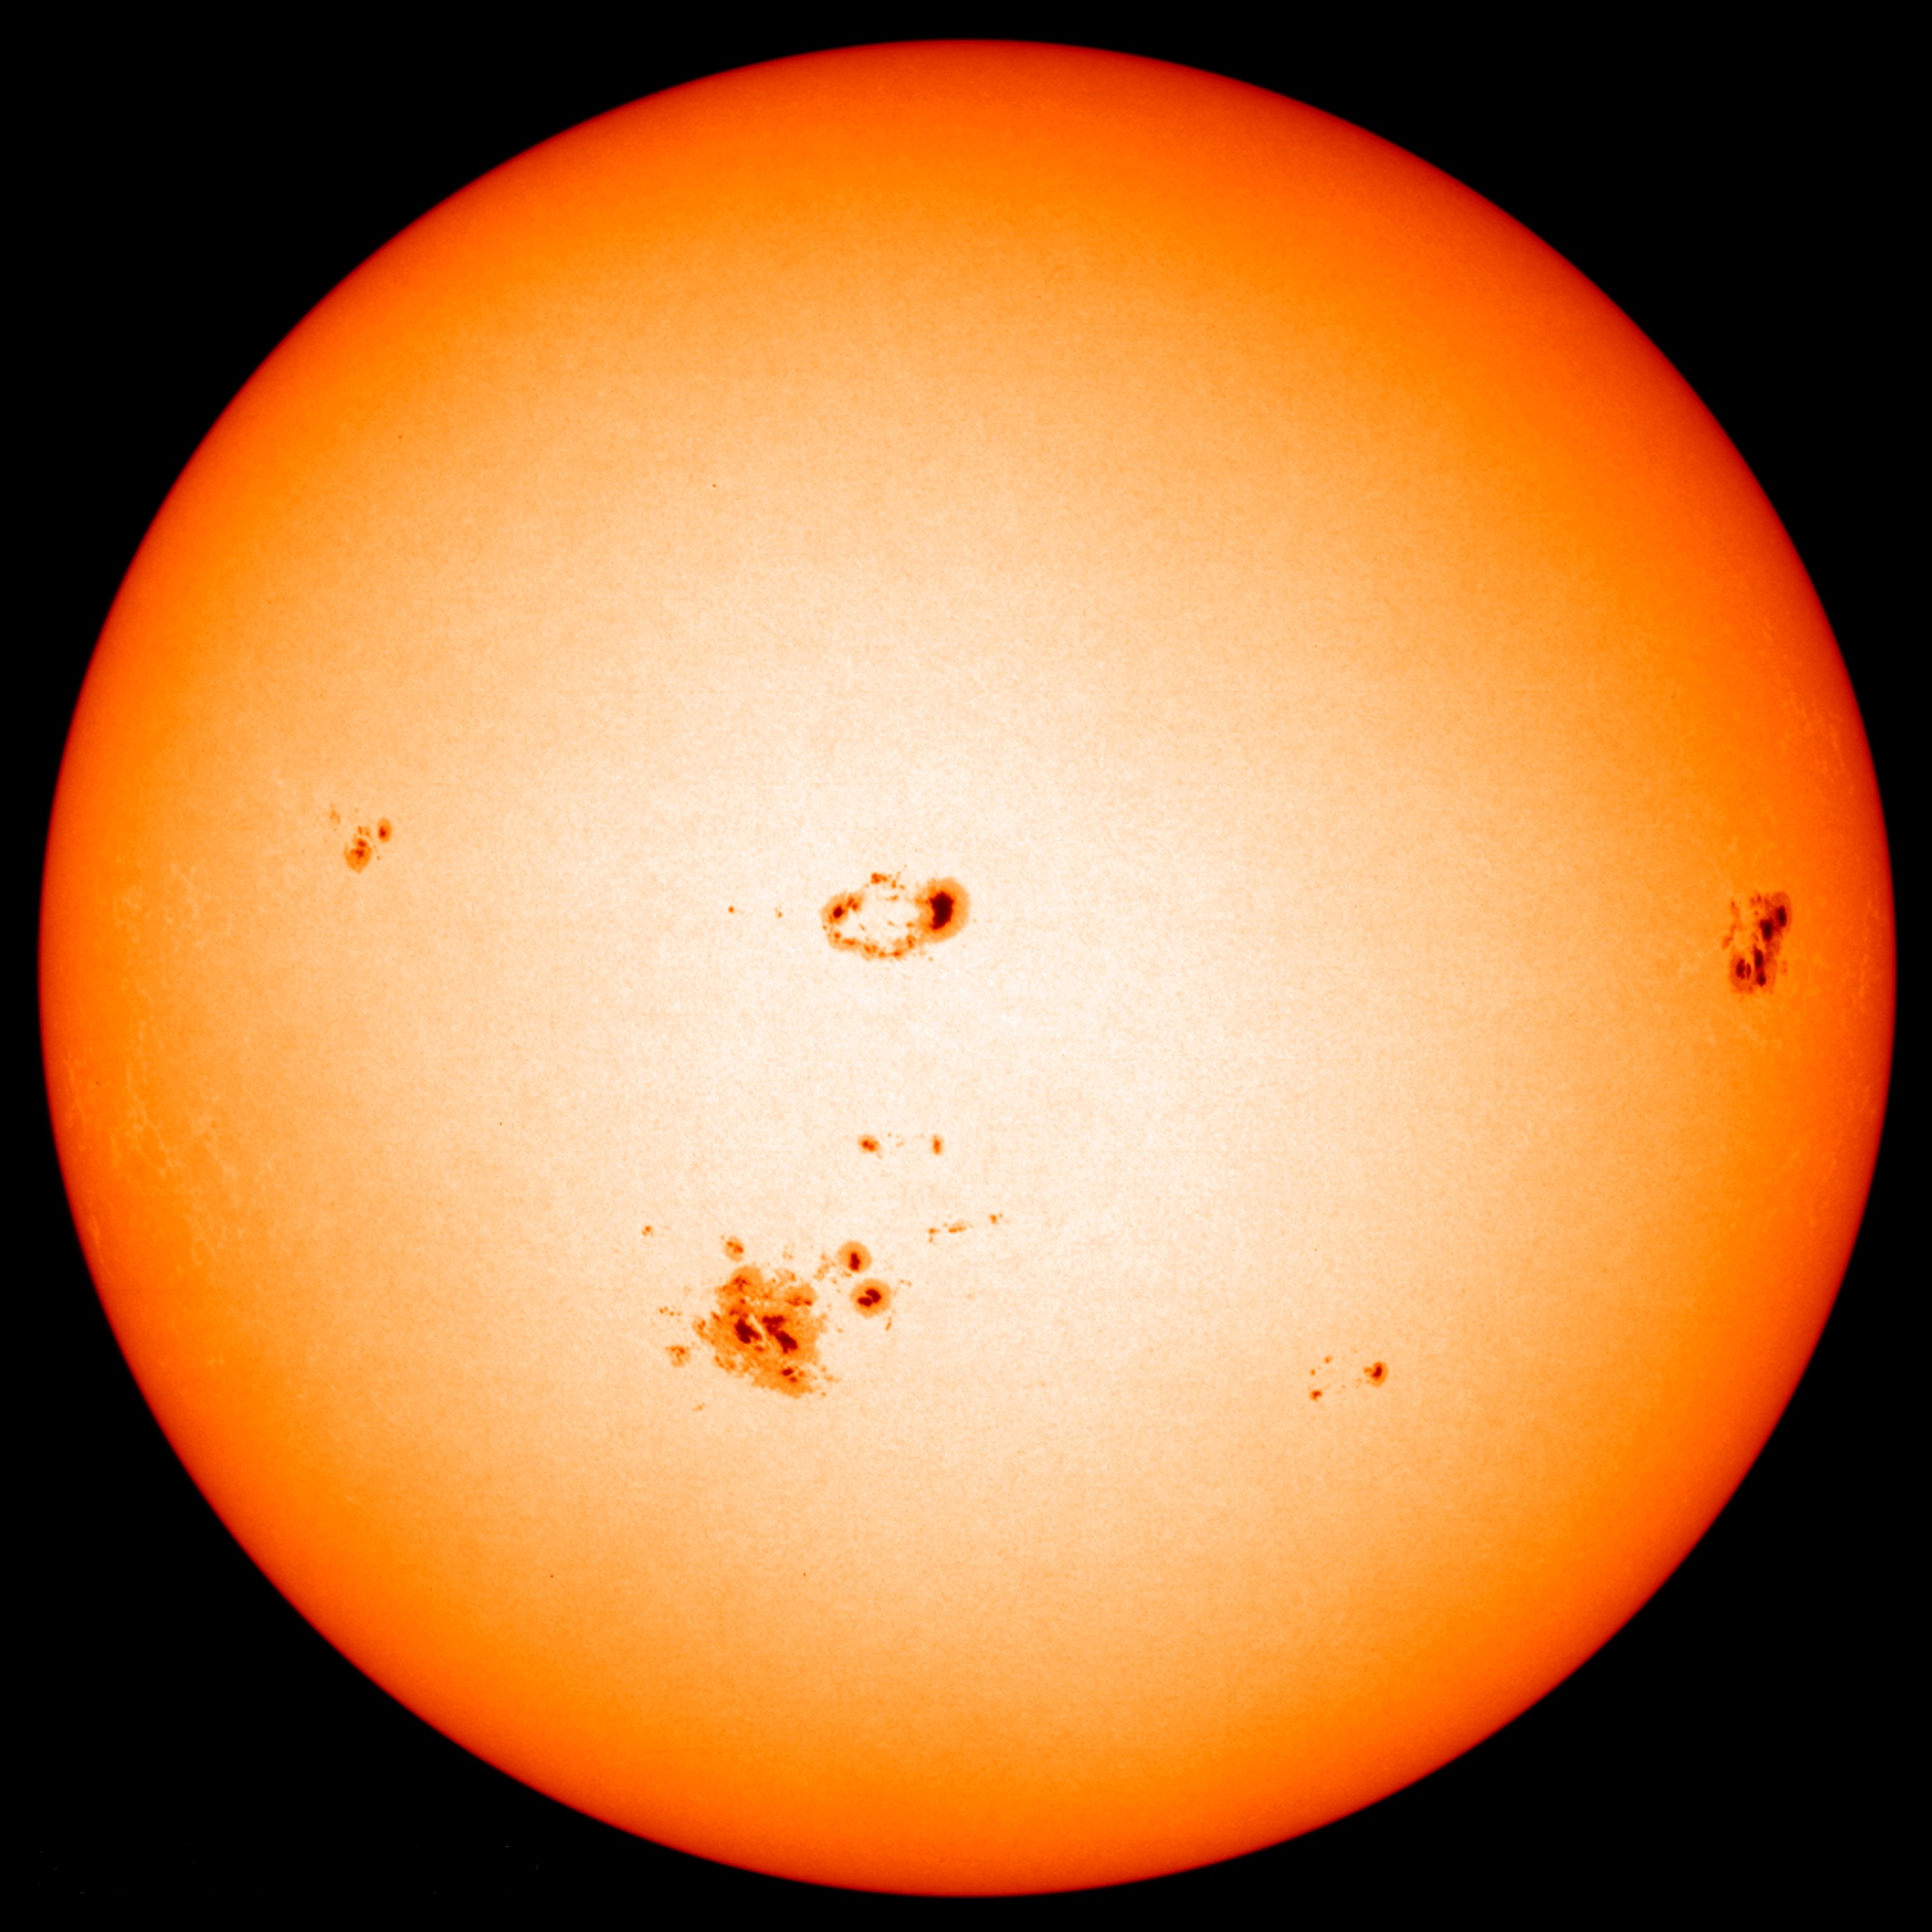
On May 28 the daily sunspot number was 11, the lowest non-zero sunspot number possible. This means there was just one sunspot group visible. There are no sunspot numbers between 1 and 10, because there is a value of 10 for each sunspot group, and a value of 1 is added for every sunspot in the group.
The last time the daily sunspot number was 11 was July 16, 2014 and the following day the sunspot number was zero. Note that this was just a few months after the peak of cycle 24, which I reckon to be around February and March 2014 using our three month moving average.
Prior to that we look back to January 14-15, 2011 to find the sunspot number at 11 on both days, on the rising side of cycle 24.
Look here for a long range forecast of smoothed sunspot numbers: http://1.usa.gov/1HOVlDP . These are International Sunspot numbers, on a different scale from the ones we present in this bulletin. Note it shows the current cycle peaking in March and April 2014, just like our 3-month moving averages of daily sunspot numbers. Four years in the future we see the next cycle minimum in summer 2019.
We keep track of a 3-month moving average of sunspot numbers to spot trends and figure our cycle peaks and minima. At the end of May we now know the most recent 3-month average.
The average centered on December 2014 through April 2015 is 107.8, 98.2, 78.1, 68.2 and 72.4, so we saw a small uptick in the latest numbers. Now to make us all feel better, I will cherry pick data. The monthly sunspot averages for March, April and May 2015 were 61.7, 72.6 and 83. No foolin’!
Check out “Best NASA Footage of Giant Sunspots” here: http://www.fromquarkstoquasars.com/best-nasa-footage-giant-sunspots/ . Be sure to click each image to get a better look, and take the video sequence up to full HD resolution by clicking the gear in the lower right corner and selecting Quality: 1080 or 720.
Steve Sacco, NN4X, of Saint Cloud, Florida passed along an interesting article about plasma tubes. Don’t miss the comments:
http://io9.com/large-plasma-tubes-confirmed-to-exist-above-the-earths-1708434105
Jeff Hartley, N8II, of Shepherdstown, West Virginia sent this report:
“It has been a fun week on the radio with exceptional polar openings on 15 meters, the WPX CW contest and a 6 meter opening on double hop to VE5, UT, CO, AZ, and CA on Tuesday evening followed by a good Caribbean opening to Cuba, KP4, FG, and HI3 Wednesday morning.
“Considering the solar flux has hovered just below or above 100, the polar path openings morning and evening have been amazing on 15 meters in the past week. Having the North Pole illuminated 24 hours a day makes for some great polar openings. The solar flux level seems to matter much less for good openings during the summer months than the rest of the year. And the K index has been low.
“During the WPX contest May 30-31, conditions on 15 meters may have been a bit below normal Saturday, but there was still plenty of DX to be worked and Sunday was considerably better except for a lack of strong JA signals from 0000Z-0200Z. Around 0200Z, my JA vs. Chinese QSOs were running neck and neck, very surprising. The band was open well to SE Asia and China every morning and evening. I worked about 20 total Chinese QSOs including several never heard before with prefixes such as BH4, BG3, BG6, BG8, and BG9 as well as working YE1, YB2, YC1, XW1 (heard every morning and evening), XV9, HS4, HS0, E21, 9V1, 9V50, and JT5. Many Far East signals were S9 or better!
“In addition the South Pacific was loud all the way out to VK and ZL the first evening. I worked the Azores around 0200Z with no northern EU then, but right before the band closed I made long path EU QSOs with S50 and UR. Saturday morning at 1200Z started with only Eastern EU to Central Asia coming through, with western EU finally loud around 1245Z.
“Stations in 7Z1 (Saudi Arabia), 4L8, and two A65 in the UAE were worked. By 1800Z, there were still plenty of loud big gun EU stations, but northern EU was gone along with Eastern EU north of UR and UA6.
“By 2100Z, near midnight in Eastern EU, conditions had improved with loud signals from all over EU including Scandinavians, then signals began fading fast around 2200Z.
“Sunday was even better in our morning into the whole northern hemisphere including loud SE Asians and JAs and even the very poorly equipped EU stations were good copy from 1200Z-1500Z. EU was fading out by 2100Z, but I finished the last 15 minutes running JAs.
“Conditions into Asia seemed even better in the late morning of June 2, working very loud prefixes YC8, YB0, 7K4 (Japan), JH1, and BD7. Late morning on June 3 was also good with strong signals from EU Russia and RX0SA on 15 CW.”
Last week during the Seattle International Film Festival I attended a screening of The Russian Woodpecker, a documentary about the Soviet cold war era Duga 3 over-the-horizon HF RADAR that plagued HF radio users all over the world during the 1970s and 1980s. Like many of the festival films, the film maker attended the first showing and answered audience questions afterward.
The film was factual, but of course part of the story were the conspiracy theories which naturally arise in a society in which information is tightly controlled. The director told us he used a small helicopter drone to capture the wonderful high resolution close-up footage of the massive antenna system, which sits within the Chernobyl Exclusion Zone in Ukraine.
Among the impressive hardware seen in this film, some of my favorites were the large black rotary dial telephones left behind in the facility. I would love to have one, and still have a landline to hook it to.
See:
http://www.sundance.org/projects/the-russian-woodpecker
https://www.youtube.com/watch?v=9rd4ARsbg_0
For more information concerning radio propagation, see the ARRL Technical Information Service at http://arrl.org/propagation-of-rf-signals. For an explanation of the numbers used in this bulletin, see http://arrl.org/the-sun-the-earth-the-ionosphere. An archive of past propagation bulletins is at http://arrl.org/w1aw-bulletins-archive-propagation. More good information and tutorials on propagation are at http://k9la.us/.
Archives of the NOAA/USAF daily 45 day forecast for solar flux and planetary A index are in downloadable spreadsheet format at http://bit.ly/1IBXtnG and http://bit.ly/1KQGbRm .
Click on “Download this file” to download the archive and ignore the security warning about the file format.
Monthly propagation charts between four USA regions and twelve overseas locations are at http://arrl.org/propagation.
Instructions for starting or ending email distribution of ARRL bulletins are at http://arrl.org/bulletins.
Sunspot numbers for May 28 through June 3 were 11, 23, 27, 47, 38, 39, and 55, with a mean of 34.3. 10.7 cm flux was 93, 92.3, 95, 94.3, 100.4, 101, and 108.5, with a mean of 97.8. Estimated planetary A indices were 7, 7, 5, 5, 8, 3, and 4, with a mean of 5.6. Estimated mid-latitude A indices were 8, 5, 5, 6, 9, 4, and 5, with a mean of 6.
Photo Gallery
Back


