The K7RA Solar Update
Over the past reporting week, April 14-20, average daily sunspot numbers rose from 32 to 40, while average daily solar flux declined from 106.1 to 100.8.
Average daily planetary A index declined from 12.4 to 10.9, but average daily mid-latitude A index rose slightly from 8.3 to 8.9.
The mid-latitude A index uses 3-hour data from a magnetometer at Fredericksburg, Virginia, and the planetary numbers are derived from readings at Sitka, Alaska; Meanook, AB, Canada; Ottawa ON, Canada; Fredericksburg, Virginia; Hartland, UK; Wingst, Germany; Niemegk, Germany; and Canberra, Australia. An example of a magnetic observatory is the one in Alberta, Canada at Meanook. See http://www.geomag.nrcan.gc.ca/obs/mea-en.php for a photo and history.
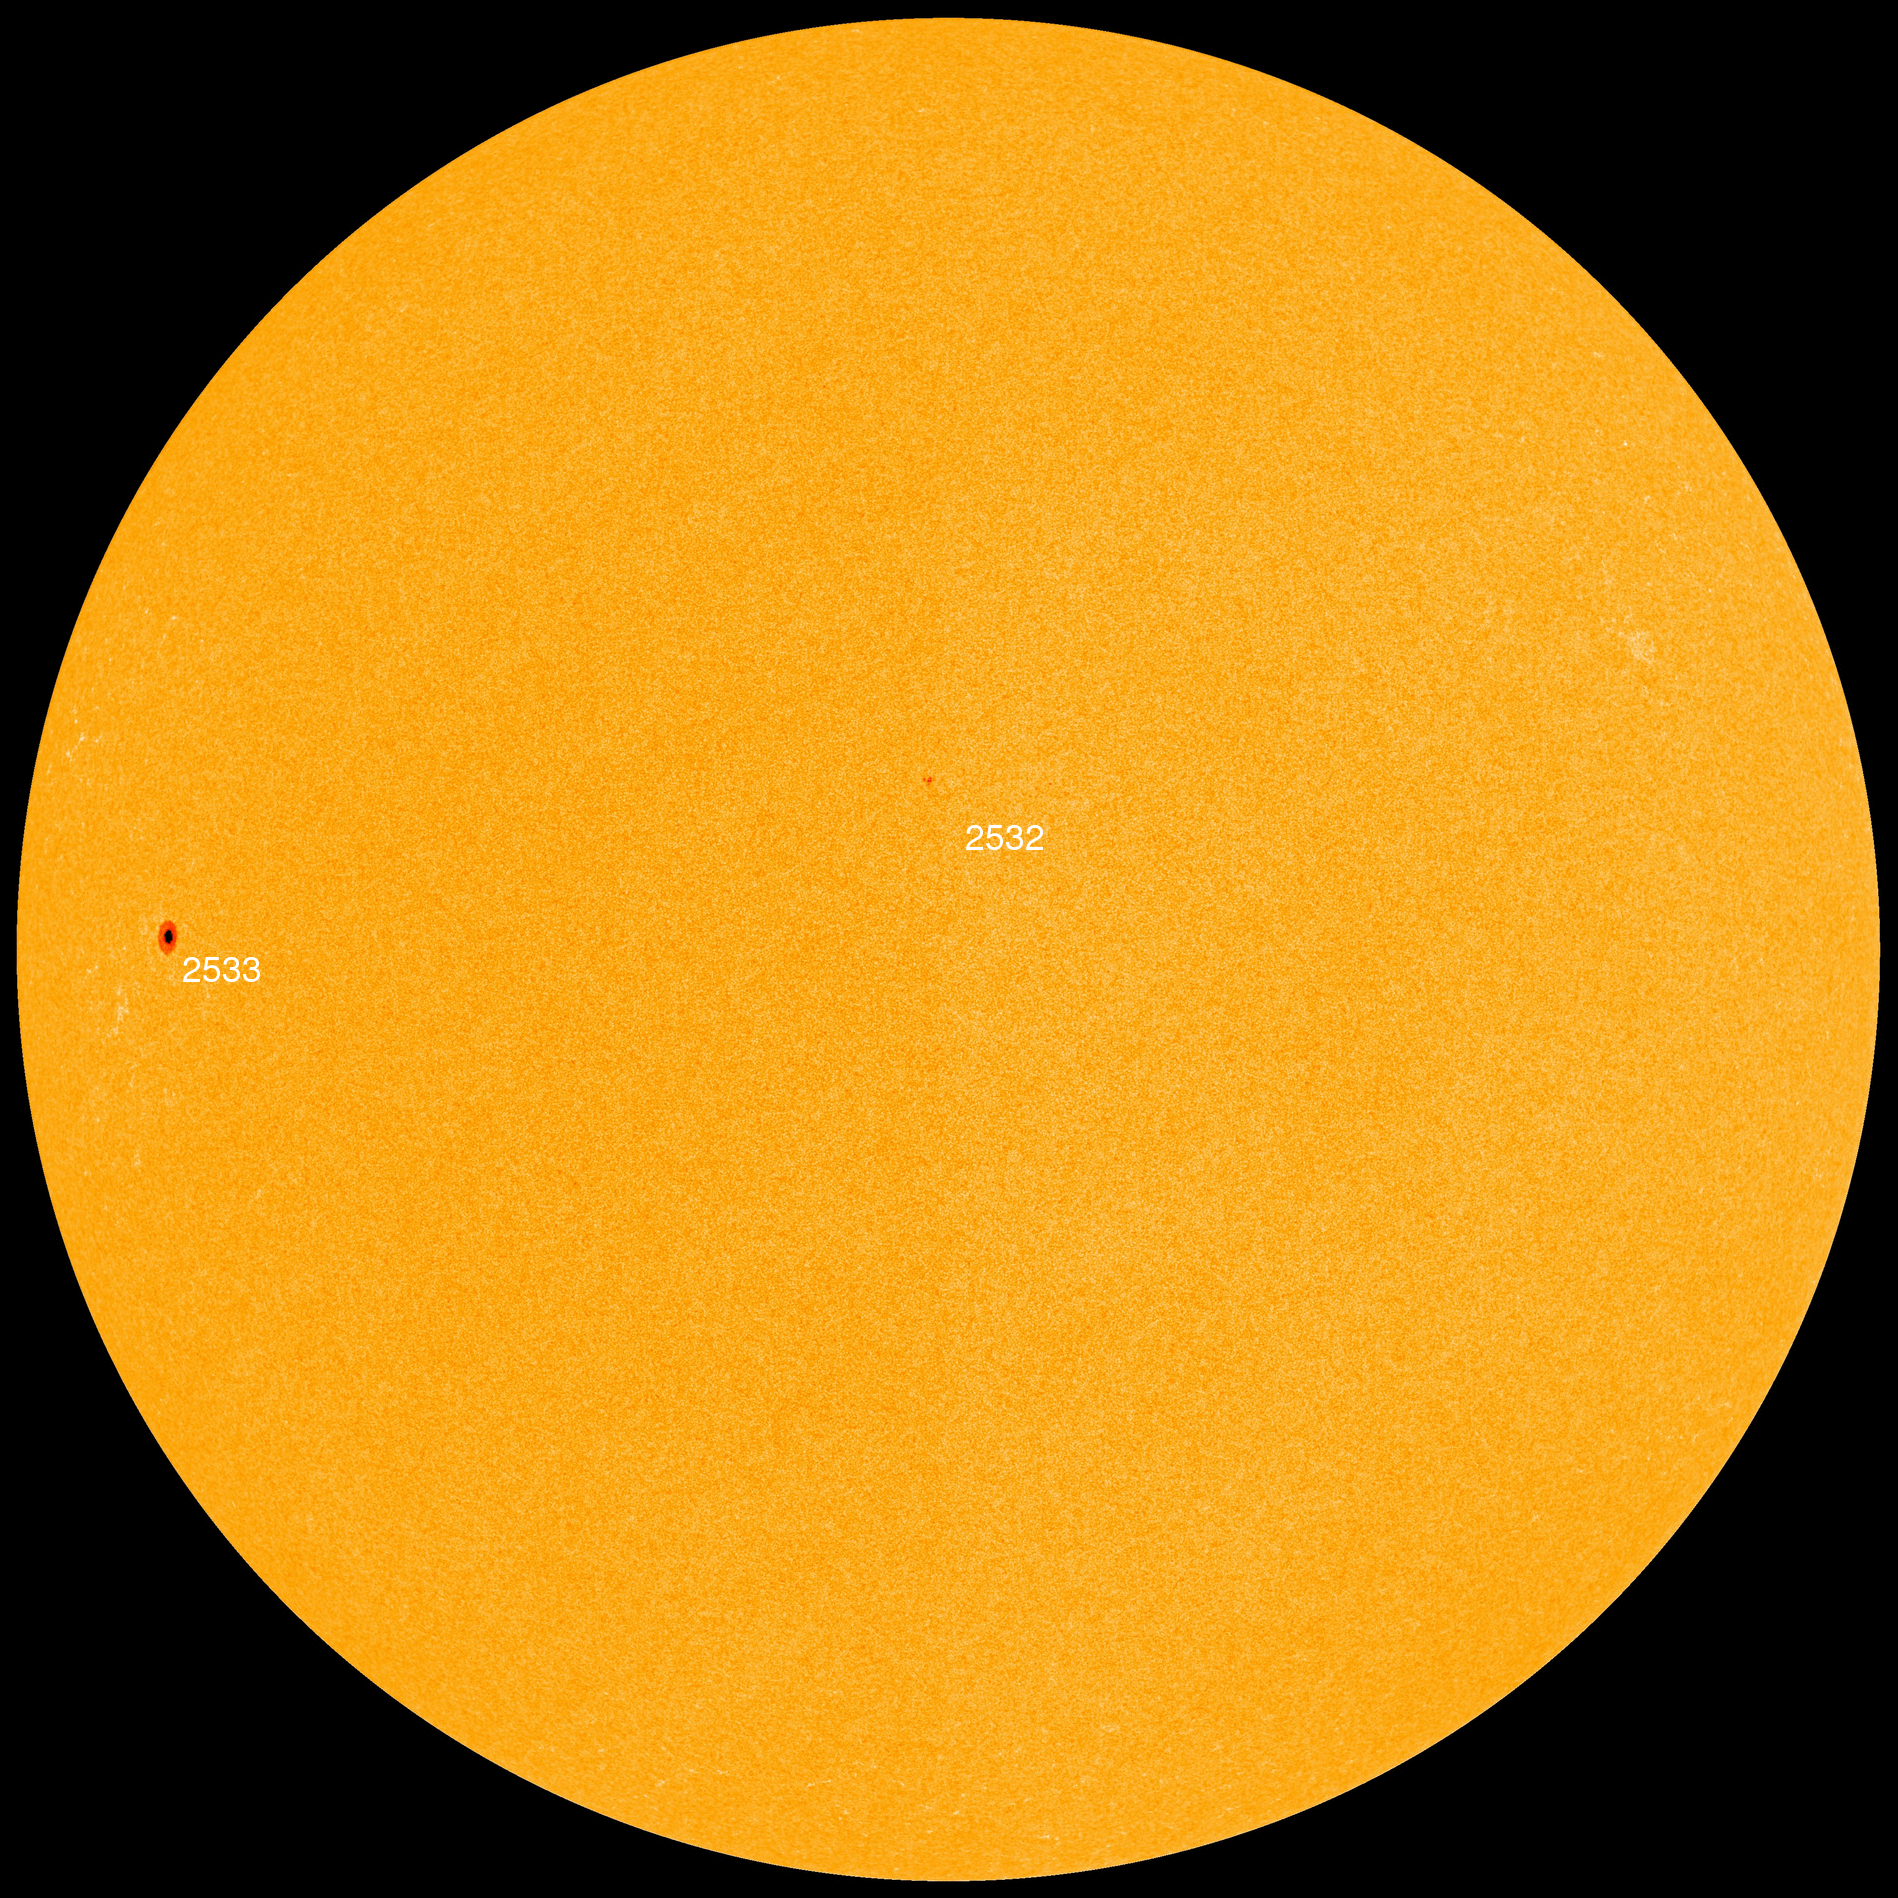
We continue to see weak sunspot groups. There was a new one on April 13, another on April 16 and another on April 20.
The latest (Thursday, April 21, 2016) prediction has solar flux values at 75 on April 22, 80 on April 23-28, then 88 and 98 on April 29-30, 95 on May 1-2, 100 on May 3-5, 95 on May 6, 98 on May 7-12, 92 on May 13-14, 102 on May 15-16, 95 on May 17-18, 97 on May 19-20 and 95 on May 21-26.
Predicted planetary A index is 5, 16 and 12 on April 21-23, 10 on April 25-26, then 8, 5, 20, 15 and 8 on April 27 through May 1, 5 on May 2-3, 12 on May 4, 5 on May 5-8, then 18, 25, 20, 8 and 5 on May 9-13, 12 on May 14-16, 8 on May 17, 5 on May 18-19, then 10 and 12 on May 20-21, and 10 on May 22-23. The planetary A index then rises to 20 on May 26, and back to 5 for six of the seven days ending the 45 day forecast period.
F.K. Janda, OK1HH, sends us the following geomagnetic activity forecast for the period April 22-May 18, 2016.
“The geomagnetic field will be:
Quiet on April 27, May 7, 12, 16-18
Mostly quiet on April 22, 28, May 1, 3, 6, 13, 15
Quiet to unsettled on April 25-26, May 2, 4, 8
Quiet to active on April 24, 29, May 9, 11, 14
Active to disturbed on April 23, 30, May 5, 10
Increased solar wind is expected on April 23-26, 29-30, May 4-5, 10-11, 14.”
Dick Bingham, W7WKR, sent a link for a balloon flight (unmanned, or maybe unpersoned) using amateur radio with WSPR on 20 and 30 meters, providing telemetry and position data. See http://bit.ly/243HFCd. Dig deep, there is a lot of fascinating data there. Note the circuitous route the balloon took.
David Moore sent this link to some SDO images: http://bit.ly/243MBqR
Pay no attention to the subsequent “NASA Flat Earth Cover-Up” video which may follow.
Tomas Hood, NW7US, would like to share this with us:
"Take a front-seat view of the Sun in this 30-minute ultra-high definition movie in which NASA SDO gives us a stunning look at our nearest star.
“This movie provides a 30-minute window to the Sun as seen by NASA's Solar Dynamics Observatory (SDO), which measures the irradiance of the Sun that produces the ionosphere. SDO also measures the sources of that radiation and how they evolve.
“Charged particles are created in our atmosphere by the intense X-rays produced by a solar flare. The solar wind, a continuous stream of plasma (charged particles), leaves the Sun and fills the solar system with charged particles and magnetic field. There are times when the Sun also releases billions of tons of plasma in what are called coronal mass ejections. When these enormous clouds of material or bright flashes of X-rays hit the Earth they change the upper atmosphere. It is changes like these that make space weather interesting.
“Sit back and enjoy this half-hour 4k video of our star: https://www.youtube.com/watch?v=sq4PlyNkm2Y “
For more information concerning radio propagation, see the ARRL Technical Information Service at http://arrl.org/propagation-of-rf-signals. For an explanation of the numbers used in this bulletin, see http://arrl.org/the-sun-the-earth-the-ionosphere. An archive of past propagation bulletins is at http://arrl.org/w1aw-bulletins-archive-propagation. More good information and tutorials on propagation are at http://k9la.us/.
My own archives of the NOAA/USAF daily 45 day forecast for solar flux and planetary A index are in downloadable spreadsheet format at http://bit.ly/1VOqf9B and http://bit.ly/1DcpaC5.
Click on “Download this file” to download the archive, and ignore the security warning about file format. Pop-up blockers may suppress the download.
Monthly propagation charts between four USA regions and twelve overseas locations are at http://arrl.org/propagation.
Instructions for starting or ending email distribution of ARRL bulletins are at http://arrl.org/bulletins.
Sunspot numbers for April 14 through 20 were 45, 69, 51, 35, 28, 28, and 24, with a mean of 40. 10.7 cm flux was 111.1, 112.4, 113.2, 102.1, 94.6, 89.1, and 83.2, with a mean of 100.8. Estimated planetary A indices were 23, 9, 12, 19, 5, 3, and 5, with a mean of 10.9. Estimated mid-latitude A indices were 14, 9, 8, 17, 7, 3, and 4, with a mean of 8.9.
Photo Gallery
Back


