The K7RA Solar Update
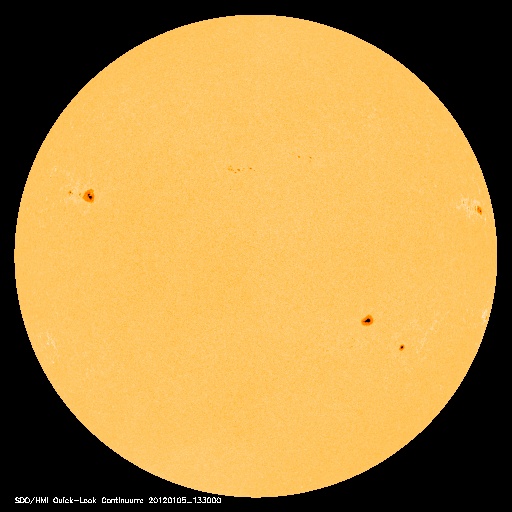
We’re continuing to see good conditions, although sunspot activity has declined a bit. The average daily sunspot numbers for December 29-January 4 declined nearly 20 points (when compared to the previous seven days) to 88.1; this is the lowest reported weekly sunspot number average since September 2011. The average daily solar flux was off 6.4 points to 143.1. Sunspot numbers for December 29-January 4 were 105, 104, 68, 61, 83, 95 and 101, with a mean of 88.1. The 10.7 cm flux was 147.1, 141.1, 132.9, 130, 134.7, 134.6 and 136.2, with a mean of 136.7. The estimated planetary A indices were 7, 6, 4, 4, 5, 7 and 3, with a mean of 5.1. The estimated mid-latitude A indices were 7, 5, 5, 4, 4, 9 and 3, with a mean of 5.3.
The near term outlook is for solar flux at 140 on January 5-6, 135 on January 7-8, 130 on January 9-11, 125 and 135 on January 12-13, and then back to 140 on January 14-21. The next short term peak is expected at 150 on January 24-26. The expected planetary A index for January 5-9 is 5, 8, 15, 10 and 8, then back down to 5 on January 10-27. That predicted A index of 15 on January 7 -- if accurate -- will be the highest since October 25, when it was 27, and 31 the day before. That activity was sparked by a coronal mass ejection that affected earth around 1800 UTC on October 24.
In The ARRL Letter for January 5, I indicated a problem with the planetary A index numbers we are getting from NOAA. I made an inquiry, and heard from Mike Husler of NOAA/SWPC. NOAA is no longer getting planetary A and K index data from the USAF, but is now doing their own estimates. But their estimates seemed to be too low, so they have changed their method for calculating planetary A and K indices.
Mike Husler wrote: “A comparison of our new real-time Kp estimate with the official values for October-December showed that we were tending to estimate too low. In order to improve the situation, we reran the fits between stations Ks (as they would be derived using our real-time algorithm) and official Kp to get an updated table of conversion coefficients. The new values have been deployed as of January 4, 2012 at 1500 UTC. For October 19-December 15, 2011, we found the following improvement in performance of the estimate compared to the official values:
“Kp: Mean absolute error decreases from 0.44 to 0.24, Average bias improves from -0.41 to 0.00
“Ap: Mean absolute error decreases from 1.93 to 0.98, Average bias improves from -1.69 to -0.34
“You should generally see somewhat higher Kp and Ap values than you have been seeing previously. The values from October 1, 2011 forward are NOAA Kp values with the correction stated above, and the values prior to that are from the USAF Kp.”
Mike said that they are currently going back and correcting data for the last few months of 2011. I do not know what he meant by “official values,” but I suspect that since the Ap and Kp values are called estimates, there is some other longer term method for determining “official values”.
Mike also told me about a web page for general information about the Kp and Ap indices from the official source. Here is a link to the data files that are updated twice per month. I recommend people use these data if they need something that is for previous months. “
A new solar cycle prediction was released on January 3, revised slightly lower from the prediction released less than three weeks before, on December 16. The key phrase from the December 16 prediction: “We find a starting time of October 2008 with minimum occurring in December 2008 and maximum of about 99 in February of 2013.” This was changed in the January 3 prediction to: “We find a starting time of October 2008 with minimum occurring in November 2008 and maximum of about 96 in February of 2013.”
The Washington Post recently ran a blog post on space weather events of 2011.
We received reports on 6 meter from Jon Jones, N0JK, of Wichita, Kansas. On December 30, he wrote: “Great E-skip on 6 meters yesterday. It was open most of the afternoon and evening for many parts of the USA. There were also E-skip links from W4, W5 and W8 to E51 and ZL. K5N was a Grid DXpedition active yesterday from the line from two rare grids, DM90/DL99. The E-skip allowed them to give many operators two really rare new grids. I logged them at 0403 UTC on my indoor dipole. They were in to my location only about seven minutes.”
On January 5, Jon wrote: “The 6 meter band really came alive last week, with major long-lasting E-skip openings on December 30, 31 and January 1. On New Year’s Eve, I worked NP4A in grid square FK68 on double hop E-skip. On January 1, there were strong short E-skips to North Dakota, Minnesota and Wyoming. I noted spots by stations in W4 and W5 to Australia and New Zealand on E-skip links on New Year’s Eve.”
Thanks, Jon!
All times listed are UTC, unless otherwise noted.
Amateur solar observer Tad Cook, K7RA, of Seattle, Washington, provides this weekly report on solar conditions and propagation. This report also is available via W1AW every Friday, and an abbreviated version appears each Thursday in The ARRL Letter. You can find a guide to articles and programs concerning propagation here. Check here and here for a detailed explanation of the numbers used in this bulletin. An archive of past propagation bulletins can be found here. You can find monthly propagation charts between four USA regions and 12 overseas locations here. Readers may contact the author via e-mail.
Photo Gallery
Back


