The K7RA Solar Update
The bulletin appears a day early this week because ARRL Headquarters is closed for the Good Friday holiday.
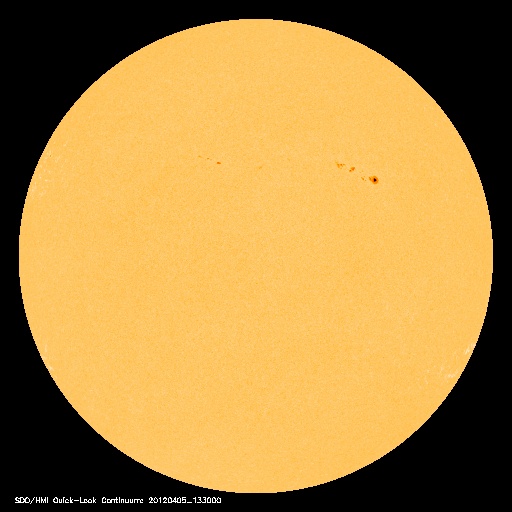
Over the past week, the average daily sunspot number and solar flux values rose slightly, even though as the week progressed, each day had a lower number than the day before. The daily sunspot number began the week at a high of 100, but ended at 60. Likewise, the daily solar flux started at 111.5, ending with 102.1. Sunspot numbers for March 29-April 4 were 100, 93, 96, 50, 67, 62 and 60, with a mean of 75.4. The 10.7 cm flux was 111.5, 110.6, 110.1, 107.3, 105.9, 103.5 and 102.1, with a mean of 107.3. The estimated planetary A indices were 4, 6, 4, 6, 8, 4 and 6, with a mean of 5.4. The estimated mid-latitude A indices were 3, 6, 4, 6, 9, 4, and 6, with a mean of 5.4.
The mild geomagnetic conditions made for a quiet week, with the only unsettled conditions on April 1-2 in very high latitude regions, with Alaska’s College A index at 11 and 17. From the April 4 USAF forecast, they see solar flux for April 5 at 105, April 6-7 at 110, 115 on April 8-10, followed by 110 on April 11, and then 100 on April 12-22. The next predicted short-term peak for solar flux is 130 on May 2-5. This is a lower peak appearing sooner when compared to the same forecast six days ago, which had a peak of 140 over May 1-2. But you can follow it yourself on a daily basis. The new daily forecast is posted after 2100 UTC, recently appearing between 2110-2130 UTC.
The predicted planetary A index is 5 on April 5-7, then 10 and 8 on April 8-9, followed by 5 on April 10-12, then 15 and 10 on April 13-14, and 5 again on April 15-23. Following the next peak at 15 on April 13, the next predicted short term planetary A index peak is also 15 on May 10, 27 days or the equivalent of one solar rotation following April 13.
Do HF conditions seem a bit dull compared to spring 2011? They should, because the average daily sunspot numbers for the past eight weeks were higher than the same weeks last year on only three out of those weeks, the remaining five were lower. The weekly averages of daily sunspot numbers have been 55.6, 55.7, 43.7, 69.4, 88.3, 75.1, 71.1 and 75.4. In 2011, these same weeks had average daily sunspot numbers at 69.9, 65, 50.9, 114, 69, 40.9, 102.1 and 68.3. The differences are more extreme when compared to last fall. Doing a little data cherrypicking, the weekly averages of daily sunspot numbers from October 13-December 7, 2011 were 158.6, 156.6, 104.1, 153.4, 145, 124, 131.7, 124.7 and 133.9. Quite a difference!
Every month, we see a slight tweaking in NASA’s smoothed sunspot number prediction for the peak of the current solar cycle. On March 2, 2012, they predicted a smoothed sunspot number maximum “of about 59 in early 2013.” On April 2, the latest forecast predicted a smoothed sunspot number “of about 61 in the spring of 2013.”
Marv Bloomquist, N5AW sent some data about the T index used by the Australian Government IPS Radio and Space Services. They say: “The T index is an indicator of the highest frequencies able to be refracted from regions in the ionosphere. The higher the T index, the higher the frequencies able to be refracated from an ionospheric region. The index is based on the measurement of ionospheric foF2 obtained from ionograms.” So this is data from ionospheric sounders -- which beam a swept-frequency radio wave straight up and analyze the reflection coming back. Marv points out that compared with their predictions, they believe the T index peaked in November 2011. The data is in a table here and covers the T index from January 1938 through the present month -- and into the future until December 2018.
After the story in last week’s bulletin, Marv also recommended this tool to get a prediction for conditions over any path, over the current day. Just click on any two points of interest on the map, watch the green arc indicating the path and then click on the “Do Prediction” button. The result is a very basic rendering using plain ASCII characters. The OWF figure represents “Optimum Working Frequency.”
Patrick Dyer, WA5IYX, of San Antonio, Texas, wrote that the Texas FM signal into Mexico that was mentioned in last week’s bulletin was an example of tropospheric propagation: “That morning, I was getting somewhat rare FM band signals from Eastern New Mexico and the Texas Panhandle for several hours.
Mike Carter, K8CN, of Durham, New Hampshire, sent in a link that provides “an interesting example of using raw solar data from the various solar imaging instruments and representing them in audible form.” I found it most interesting to up the video resolution to 720p (just click on the sprocket-shaped circle at the bottom to adjust) and run it in full screen mode. That way, I could more clearly see the passage of time represented.
It is certainly impressive, although it does bring to mind a much cruder, but still an unusual, representation for data that Stan Shankman, K7SJB, told me about once. Several decades ago, Stan found a Hugo Gernsback popular science pulp magazine from the 1930s, and on the cover was an illustration of men gathered around a microscope; the fellow peering into it was wearing headphones and had a shocked expression on his face. The lurid headline said something like “Scientists Hear Germs!” Stan said the article described a device that passed light the microscope and onto a solar cell, which was then modulating the sound in the headphones. I just did a web search for that phrase, and must have found the magazine on an auction site, although it is different from my memory of his description. It shows one fellow instead of a group, and the headline says, “Scientists Hear Germs Die!” The other headline mentions what might be an early baby monitor, “Radio Guards the Baby.” It is the July 1932 issue of Radio News.
Gregory Andracke, W2BEE, reminded me to share a March 31 video put out by some smart folks who each year try to outdo their previous year’s wowee-zowie prank. I saw it last week, and I must admit it had me totally fooled for quite a while, or at least a fair number of minutes. What do you think?
All times listed are UTC, unless otherwise noted.
Amateur solar observer Tad Cook, K7RA, of Seattle, Washington, provides this weekly report on solar conditions and propagation. This report also is available via W1AW every Friday, and an abbreviated version appears each Thursday in The ARRL Letter. You can find a guide to articles and programs concerning propagation here. Check here and here for a detailed explanation of the numbers used in this bulletin. An archive of past propagation bulletins can be found here. You can find monthly propagation charts between four USA regions and 12 overseas locations here. Readers may contact the author via e-mail.
Photo Gallery
Back


