The K7RA Solar Update
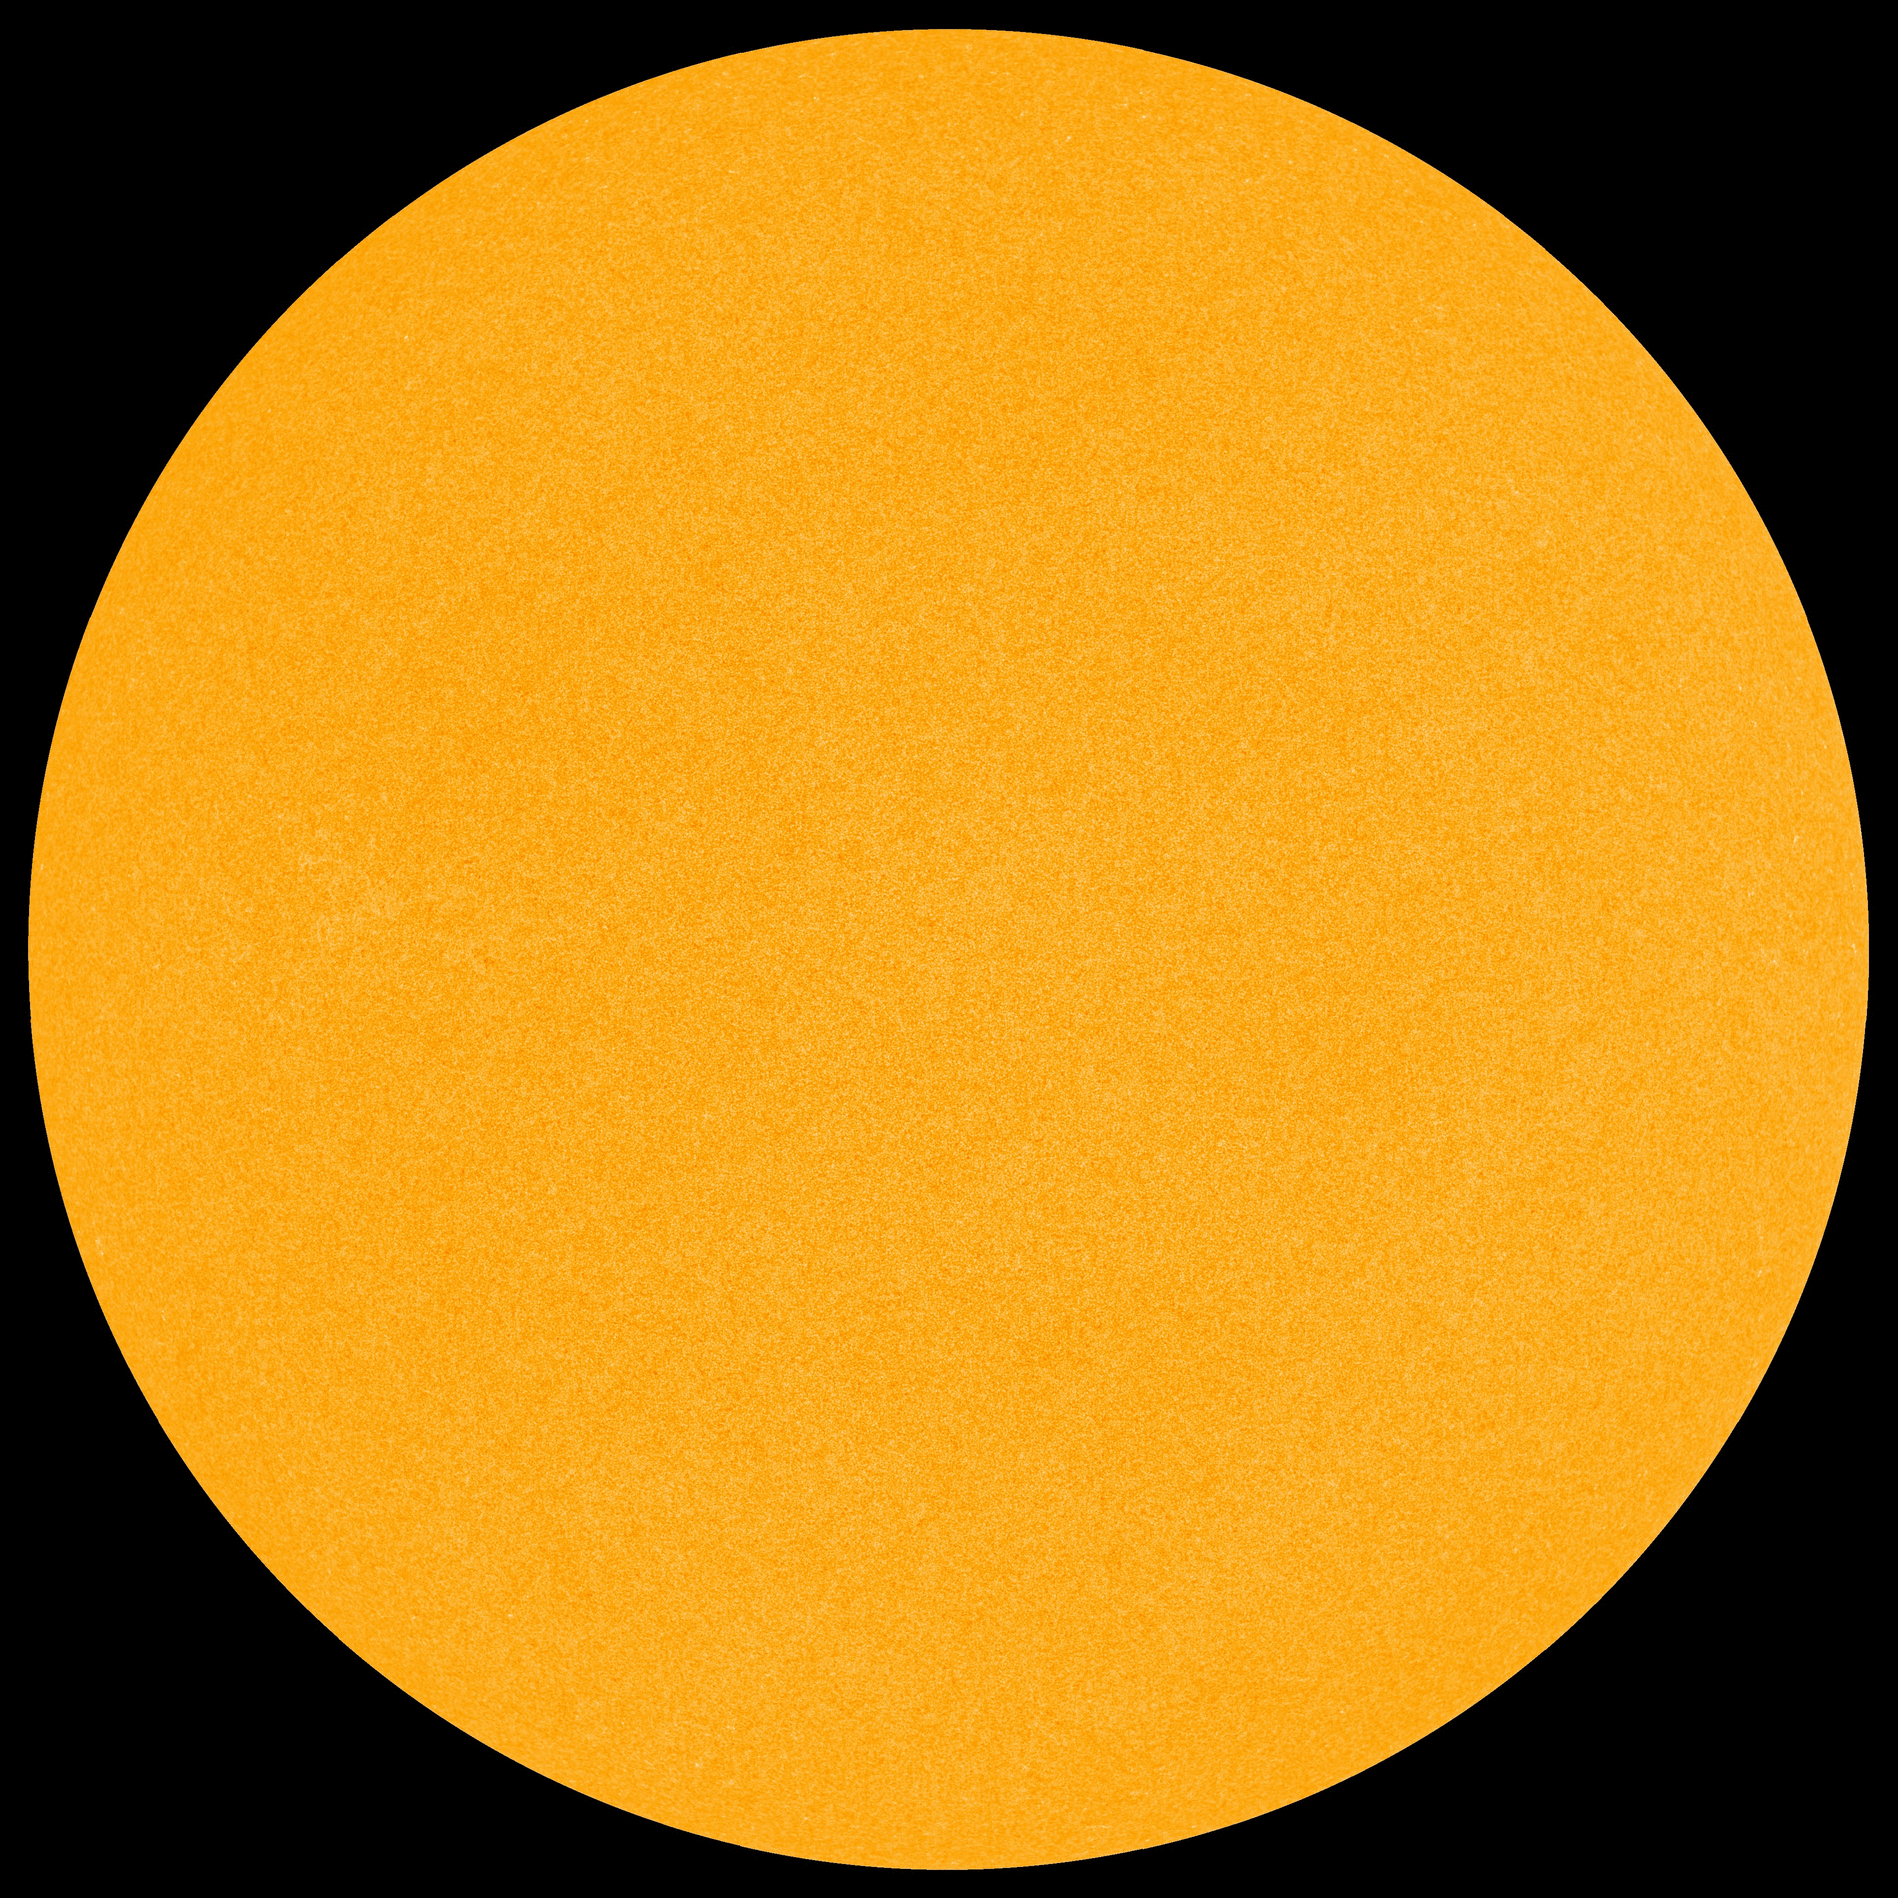
As of Thursday, July 12, there have been no sunspots visible for 16 days consecutively.
Spaceweather.com pointed out that to find an equally long stretch of no sunspots, we must look back to November 2009 when we were emerging from the deepest solar minimum in a century. At the lowest of the low activity in 2008, the sun was blank for 52 consecutive days, they reported, and that seems to be from July 21, 2008 through September 10, 2008, as shown here: ftp://ftp.swpc.noaa.gov/pub/indices/old_indices/2008_DSD.txt
However, my own record shows a slight break in that period, with a sunspot number of 11 on August 21-22, 2008. Where did I get this, nearly ten years ago? Although NOAA did not report this (as seen in the link above), Spaceweather.com did. If you look in their archive for those dates, you will see it reported. They characterized it as a “relatively small spot.”
I asked Dr. Tony Phillips of Spaceweather.com about this, and he replied: “Good point! To get those 52 days, I went through the official NOAA sunspot records and ironically did not check Spaceweather.com. They might have considered the spot a ‘pore’ and not a fully developed sunspot. At any rate, the overall picture is still the same: If this solar minimum is anything like the last one, we will eventually look back on 15 day stretches of spotlessness as relatively brief intervals.”
Was it so small that NOAA didn’t record it? It was there for two days, so I decided to include it in my record. My personal record of solar flux and sunspots is preserved and updated in the Solar Data Plotting Utility created by Scott Craig, WA4TTK: http://www.craigcentral.com/sol.asp
Note he has a recent update for the data, and you can continue to automatically update your copy weekly using a copy of this bulletin.
Although there were no sunspots last week, we did see an increase in solar flux, from an average of 68.2 in the previous week to 71.5 in the July 5-11 period. This is not a large difference.
Average daily planetary A index increased from 4 to 7.3, while average daily mid-latitude A index increased from 4 to 7.9.
Predicted solar flux is 72 on July 13-19, then 73, 74, 72, 72, and 70 on July 20-24, then 68 on July 25 through August 2, 70 on August 3, 72 on August 4-6, 74 on August 7, 76 on August 8-16, then 74, 72, 72, and 70 on August 17-20, and 68 on August 21-26.
Not long ago I thought sunspots may return by July 17-19, when solar flux was predicted to rise to 80, but after July 7 that more optimistic forecast was scaled back to what we have now.
Predicted planetary A index is 5 on July 13-19, then 15, 8, 10, 18 and 8 on July 20-24, then 5 again on July 25 through August 4, then 12 and 8 on August 5-6, 5 again on August 7-10, 16 and 8 on August 11-12, 5 on August 13-15, then 15, 8, 10, 18 and 8 on August 16-20, and 5 on August 21-26.
Franta, OK1HH, is back with his geomagnetic forecast after his previously announced absence:
“Geomagnetic activity forecast for the period July 13 to August 8, 2018
Geomagnetic field will be:
Quiet on July 13, 25-29, August 6
Quiet to unsettled on July (15-18, 21,) 30-31, August 4
Quiet to active on July 20, 23, August 1, 3, (5, 7-8)
Unsettled to active on July (14, 19,) 24
Active to disturbed on July 22, August 2
Solar wind will intensify on July 13-15 and 20-23
Remarks:
- Parenthesis means lower probability of activity enhancement.
- Beware of paraskavedekatriafobia today!”
OH6BG has created a VOACAP tool for WRTC 2018, currently in progress: http://www.voacap.com/wrtc2018/
Also see: http://www.wrtc2018.de/en/
Also, this weekend, the IARU HF Championship: http://www.arrl.org/iaru-hf-championship
Paul Merrill, W7IV, of Templeton, California wrote: “So, what do you think about all the theories of 6-meter propagation in light of this fantastic summer and the new mode of FT8? Was this propagation around all along and we just didn’t have the gain or sensitivity to make use of it?"
I’m certain this is the case. FT8 is amazingly powerful, and seemingly can peel back layers of noise and uncertainty that human ears cannot.
On July 8, Dr. Skov wrote:
"Dear Tad,
“After nearly two weeks of quiet, our Sun graces us with a much-needed boost in activity. I took this bit of down time to celebrate the American fourth of July with family, and to reflect on where the fireworks of the Sun will lead us once we pass through this solar minimum. I have some ideas. In the coming several weeks, I will ask for voluntary feedback on my Patreon project, set for pre-launch later this month. I want to ensure I am creating content that most suits your needs and leads us in the right direction as a community towards the future. Your participation means the world to me.
“The forecast this week is a bright one. We have two solar storms, albeit weak ones, on their way to Earth now. With some luck, they will bring aurora down to high-latitudes and possibly even lower! We also have a returning active region (that will likely be numbered 2716), which has already boosted solar flux back into the marginal levels for radio propagation. It is a low-level flare producer, but GPS users shouldn't worry, reception should remain decent on Earth's day side, and at low latitudes, thanks to the weak influence of these solar storms. However, GPS reception might get just a little glitchy near aurora and around dawn and dusk. Be sure to enjoy the conditions while they last!
“Cheers,
Tamitha"
See: https://youtu.be/P0pPPDrQ3Oo
Max White, M0VNG, sent this interesting article about tubes of plasma in the sky: https://bit.ly/1Ke74AV
For more information concerning radio propagation, see the ARRL Technical Information Service at http://arrl.org/propagation-of-rf-signals. For an explanation of numbers used in this bulletin, see http://arrl.org/the-sun-the-earth-the-ionosphere.
An archive of past propagation bulletins is at http://arrl.org/w1aw-bulletins-archive-propagation. More good information and tutorials on propagation are at http://k9la.us/.
Monthly propagation charts between four USA regions and twelve overseas locations are at http://arrl.org/propagation.
Instructions for starting or ending email distribution of ARRL bulletins are at http://arrl.org/bulletins.
Sunspot numbers for July 5 through 11, 2018 were 0, 0, 0, 0, 0, 0, and 0, with a mean of 0. 10.7 cm flux was 68.1, 70.5, 72, 71.6, 72.9, 72.1, and 73.3, with a mean of 71.5. Estimated planetary A indices were 17, 7, 5, 4, 3, 7, and 8, with a mean of 7.3. Estimated mid-latitude A indices were 11, 8, 6, 6, 5, 11, and 8, with a mean of 7.9.
Photo Gallery
Back


