The K7RA Solar Update
Tad Cook, K7RA, Seattle, reports: Solar activity increased this week. We saw no spotless days, and the average daily sunspot number rose from 14.7 to 28.1. Average daily solar flux was up from 76.1 to 77.2.
Average daily planetary A index rose from 4 to 9.4, due to a minor geomagnetic storm on Monday. On that day Alaska’s High Latitude College A Index was 33.
Predicted solar flux for the next 30 days is 76, 75, 74, and 74 on January 29 – February 1; 72, 70, 70, and 72 on February 2 – 5; 76 on February 6 – 10; 77 on February 11 – 20; 76 on February 21 – 2, and 75 on February 25 – 27.
Predicted planetary A index is 5, 5, and 8 on January 29 – 31; 18, 12, and 8 on February 1 – 3; 5 on February 4 – 6; 10 on February 7 – 8; 5 on February 9 – 19; 8, 12, and 12 on February 20 – 22, and 5 on February 23 – 27.
Even after a nice stretch of days with sunspots, the 10.7-centimeter solar flux seems weak. Last week and this week we reported average daily solar flux of 73.8 and 78.6. But toward the end of 2020, the three bulletins reporting data from November 19 – December 9 had average daily solar flux at 90.1, 108.1, and 91.9.
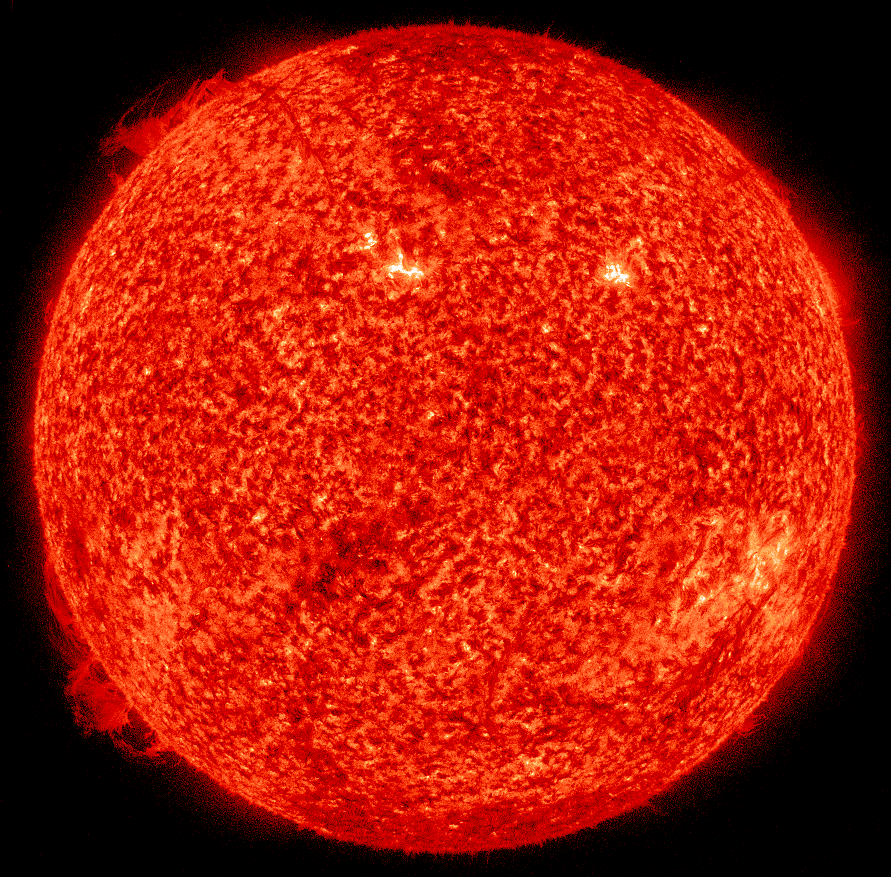
On Thursday Spaceweather.com reported a sunspot number of 26 and showed an image of two active regions on the sun, 2800 and 2797, but NOAA SESC showed a sunspot number of zero for the same day. The NOAA SESC file is the only source used for sunspot numbers reported in this report.
Here’s the geomagnetic activity forecast for the period January 29 – February 24 from F.K Janda, OK1HH.
The geomagnetic field will be:
- quiet on January 29 – 31, February 4, 10, (24)
- quiet to unsettled on February 5 – 6, 9 – 13, 17, 19
- quiet to active on February 1, 3, 7, 14 – 16, 18, 20, 22 – 23
- unsettled to active February (2, 8, 21)
- active to disturbed none predicted
- Solar wind will intensify on January (31,) February (1,) 2 – 3, (4, 8 – 10, 15 – 17, 20 – 21,) 22 – 24, (25)
Parenthesis means lower probability of activity enhancement. The predictability of changes remains low, as indicators are ambiguous.
We ran across this Universe Today article about tree rings as an indicator of historical solar activity
This weekend is the CW portion of the CQ 160-Meter Contest. Geomagnetic activity is quite low, which is a favorable indication for 160 meters.
Imagine, if you will, the worst possible solar flare, maybe worse than the infamous Carrington Event, the one that made aurora visible all the way down to the equator and set fire to telegraph offices. Some smart people have done just that. Try not to scare yourself while reading this article from the American Geophysical Union.
Presentations from last weekend’s Propagation Summit are available.
The Space Weather Woman Tamitha Skov, WX6SWW, has a new mini-course.
KA3JAW enjoys monitoring the FM broadcast band and the 11-meter band for E-skip. He reported from Pennsylvania.
Nothing heard on the FM band, but Monday, January 25, was a great radio day for both single-hop and double-hop sporadic-e (Es) on 11 meters.
The spectacular event started early in the morning at 1145 UTC until late afternoon (2154 UTC). It all began with reception of short-hop Es into southern Maine at 7 AM. Signal was 20 dB over S-9 at a range of 300+ miles.
At 2 PM ET, double-hop Es western stations were heard, AZ, CA, UT, WA and Alberta, Canada.
And if that was not enough, I was hearing west coast stations calling out to HI.
Around 3:45 PM ET, western states, southern Texas (Houston, San Antonio, Waco) along with Florida (Tampa) were heard.
Twenty-one states, two Canadian (Ontario and Alberta) and one Mexican (Tijuana), were heard. The list includes AL, AZ, CA, CT, FL, GA, IA, IN, KY, LA, ME, MI, MS, NC, OH, SC, TN, TX, UT, VA, and WA.
Sunspot numbers for January 21 – 27 were 26, 39, 34, 23, 26, 23, and 26, with a mean of 28.1. The 10.7-centimeter flux was 77.6, 78.2, 77.9, 77.6, 77.1, 75.7, and 76.3, with a mean of 77.2. Estimated planetary A indices were 3, 4, 5, 5, 17, 21, and 11, with a mean of 9.4. Middle latitude A index was 2, 3, 3, 4, 14, 9, and 9, with a mean of 6.3.
For more information concerning radio propagation, visit the ARRL Technical Information Service, read “What the Numbers Mean…,” and check out K9LA’s Propagation Page.
A propagation bulletin archive is available. For customizable propagation charts, visit the VOACAP Online for Ham Radio website.
Instructions for starting or ending email distribution of ARRL bulletins are on the ARRL website.
Share your reports and observations.
Photo Gallery
Back


