The K7RA Solar Update
A sunspot group emerged on February 10, two more on February 11, two more on February 14 and three more on February 16, when the daily sunspot number rose to 111 — the highest value for this reporting week and well above the weekly average of 75.3. The average for the previous week was 83.9. On February 17 another new sunspot region emerged, but the daily sunspot number declined from 111 to 103.
The 111 sunspot number was the highest since the end of 2021, when sunspot numbers went as high as 147 following a few days of no sunspots at all.
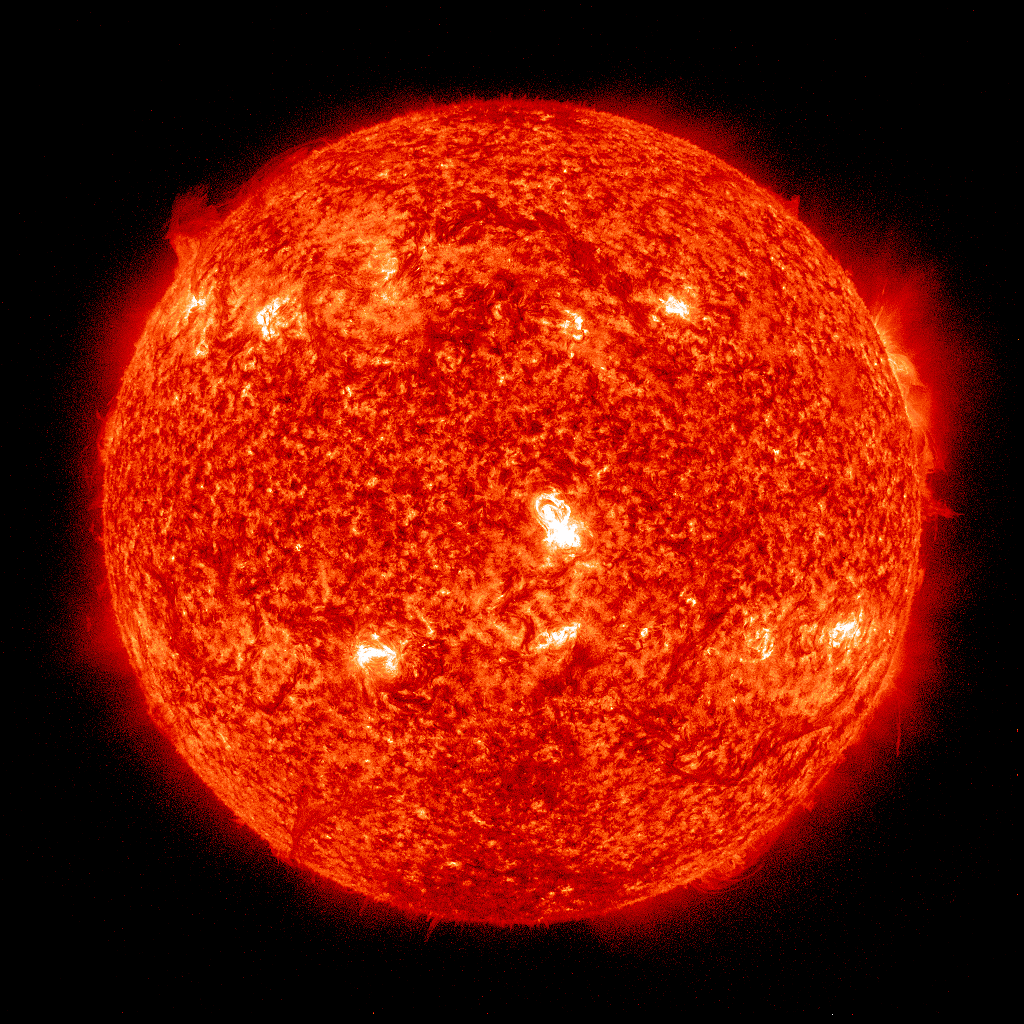
On Thursday, February 17, the Daily Sun image on Spaceweather.com showed seven sunspot groups, the whole earth-facing side of the sun peppered with spots.
Average daily solar flux declined from 126 to 110.1. Average daily planetary A index went from 14.4 to 13, and average daily middle latitude A index declined just 1.3 points to 8.3.
Why do we care about sunspot numbers? Because high values correlate with greater density in the ionosphere, which gives us better propagation at higher frequencies. Sixty-four years ago, sunspot numbers were so high that hams saw worldwide around-the-clock propagation on 10 meters. Sunspot numbers were never that high before or since. That was the peak of Solar Cycle 19. Newly licensed hams thought it would always be like that. It never was.
Predicted solar flux over the next month was downgraded from February 16 – 17 forecasts, and is 95 on February 18 – 19; 98 on February 20; 102 on February 21 – 23; 105 on February 24; 108 on February 25 – 27; 110 on February 28; 115 on March 1 – 2; 112 and 110 on March 3 – 4; 108 on March 5 – 8; 105 on March 9 – 11; 103 on March 12 – 13; 100 on March 14; 98 on March 15 – 16; 102 on March 17 – 19; 104 on March 20 – 22, 108 on March 23 – 26, and 110 on March 27.
Predicted planetary A index is 5 on February 18 – 19; 18, 15, and 12 on February 20 – 22; 10, 8, and 10 on February 23 – 25; 15 and 10 on February 24 – 25; 5 on February 26 – March 2; 12, 15, 10, and 8 on March 3 – 6; 5 on March 7 – 10; 15, 12, and 10 on March 11 – 13; 5 on March 14 – 18; 8, 5, 12, 15, 18, and 10 on March 19 – 24, and 5 on March 25 – 29.
Here’s the “Weekly Commentary on the Sun, the Magnetosphere, and the Earth’s Ionosphere” for February 10, from F.K. Janda, OK1HH.
“Solar activity has reached a moderate level, including occurrence of M-class flares. The activity on the far side of the sun was greater, as evidenced by CME observations beyond the eastern limb of the solar disk, which do not affect Earth’s ionosphere.
“We observed exceptionally poor conditions of ionospheric propagation on 80 and, especially, 160 meters on the night of February 14-15, UTC. The cause was a several-day decrease in solar radiation (X-ray level), accompanied by a decrease in the speed of the solar wind, as a source of ionization by particles. The improvement started on the morning of February 15, beginning from the eastern direction when the ionosphere was irradiated by the sun again.
“Solar activity is expected to rise only slowly in the coming days, reaching a flat quasi-peak maximum in early March. The activity of Earth’s magnetic field should increase irregularly and only slightly again on February 20 – 21 and 24 – 25 (February 22 – 24, according to other sources), causing only the usual fluctuations in propagation conditions.”
NN4X reported on February 16:
“I was a little late to the party on 10 meters, having started checking propagation on 12 meters first.
“Conditions were excellent, easily the best 10-meter long-path opening I’ve ever seen. “I was fortunate to have FT8 QSOs with these stations: BF7IEJ (1304 UTC); YC9AUB (1306 UTC); YC1THS (1319 UTC); YC7UDD (1346 UTC); VK3EW (1419 UTC); JK1OZS (1344 UTC); VR2CH (1307 UTC); VR2XYL (1305 UTC), and VR2VAZ (1339 UTC). I also worked VR2CH on 10-meter long path on February 15.
“While monitoring FT8 on 12 meters around 1905 UTC this afternoon, with the antenna pointed 90°, looking for African stations, I noticed YB0DJ decode.
“I proceeded to work him, and he was gone shortly thereafter. I’ve never seen a long path opening so far away from sunrise to sunset. Using PSKR, we can see at least some of the extent of that opening (note that the daylight/darkness shading is for the time I ran the search).”
N0JK (EM28) reported on February 17:
“A sporadic-E opening occurred on February 13 UTC. I logged W4IMD (EM84) on 50.313 MHz at 0141 UTC, the only Es station worked on 6 meters. Then, on 17 meters I worked KC5LT (EM86) at 0228 UTC on FT8 on Es. Sporadic-E openings are rare in February.”
Check out this video about ViewProp, a promising new propagation analysis tool. There is also an email list. — Thanks to The ARRL Contest Update.
Reader “Neil J.” shared this.
The Las Cruces Sun News included this article: “NMSU astronomy professors welcome new robotic system at Apache Point Observatory.
”Sunspot numbers for February 10 – 16 were 78, 86, 54, 53, 72, 73, and 111, with a mean of 75.3. The 10.7-centimeter flux was 118, 113.1, 110.5, 105.4, 106.5, 114.3, and 102.9, with a mean of 110.1. Estimated planetary A indices were 21, 20, 13, 15, 8, 5, and 9, with a mean of 13. Middle latitude A index was 12, 12, 10, 9, 6, 3, and 6, with a mean of 8.3.
For more information concerning radio propagation, visit the ARRL Technical Information Service, read “What the Numbers Mean…,” and check this propagation page by Carl Luetzelschwab, K9LA.
A propagation bulletin archive is available. For customizable propagation charts, visit the VOACAP Online for Ham Radio website.
Instructions for starting or ending email distribution of ARRL bulletins are on the ARRL website.
Share your reports and observations.
Photo Gallery
Back


